
Edexcel Specification focus:
‘Tectonic disaster trends since 1960 (deaths, affected populations, economic damage) and the reliability and accuracy of this data.’
Introduction
Tectonic disasters since 1960 show varied long-term trends in deaths, economic losses, and affected populations, shaped by development, data quality, and global hazard exposure.
Long-Term Trends in Tectonic Disaster Impacts
Global Overview Since 1960
Since the 1960s, tectonic disasters—including earthquakes, volcanic eruptions, and tsunamis—have shown fluctuating but discernible long-term trends in three key impact areas:
Deaths
Affected populations
Economic damage
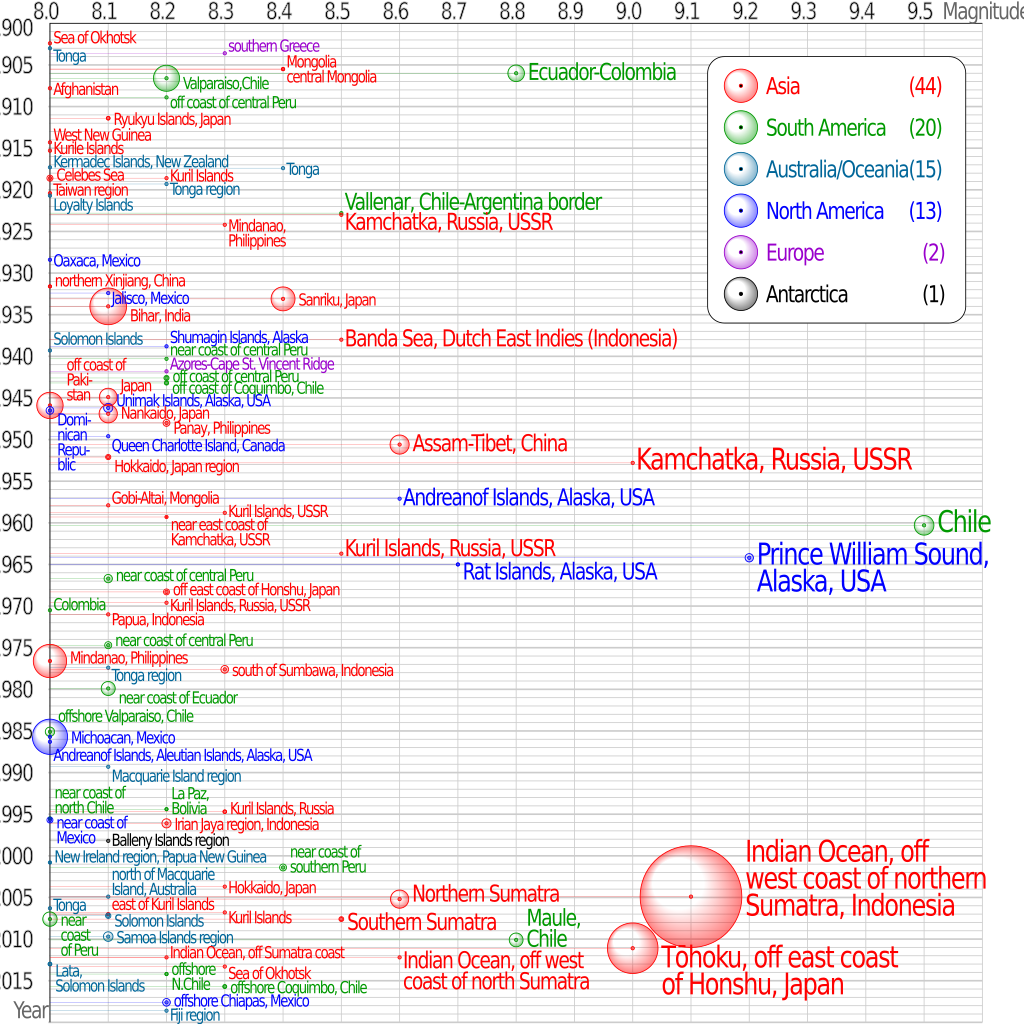
USGS compilation of all magnitude 8.0 and above earthquakes from 1900 to 2017, plotted by year. Bubble size corresponds to magnitude, and colour denotes continent. Source
Deaths from Tectonic Disasters
The number of deaths due to tectonic hazards has shown no consistent long-term decline, despite advances in prediction, preparedness, and emergency response.
High fatality events such as the 2004 Indian Ocean tsunami (~230,000 deaths) and the 2010 Haiti earthquake (~160,000 deaths) heavily skew the data.
In general, developing countries continue to experience higher mortality rates due to:
Poor building standards
Inadequate emergency infrastructure
High population densities in hazardous areas
In developed countries, despite significant hazard events, fatality numbers are usually lower due to better governance, enforcement of building codes, and robust emergency services.
Vulnerability: The degree to which a population or system is susceptible to, or unable to cope with, the adverse effects of a hazard.
One key trend is the increased exposure of people to hazards due to rapid urbanisation, especially in tectonically active zones.
Affected Populations
The number of people affected by tectonic disasters (i.e. injured, displaced, or left without shelter or basic services) has increased over time. This is largely due to:
Global population growth
Increased settlement in hazard-prone areas
Unplanned urbanisation, especially in low-income countries
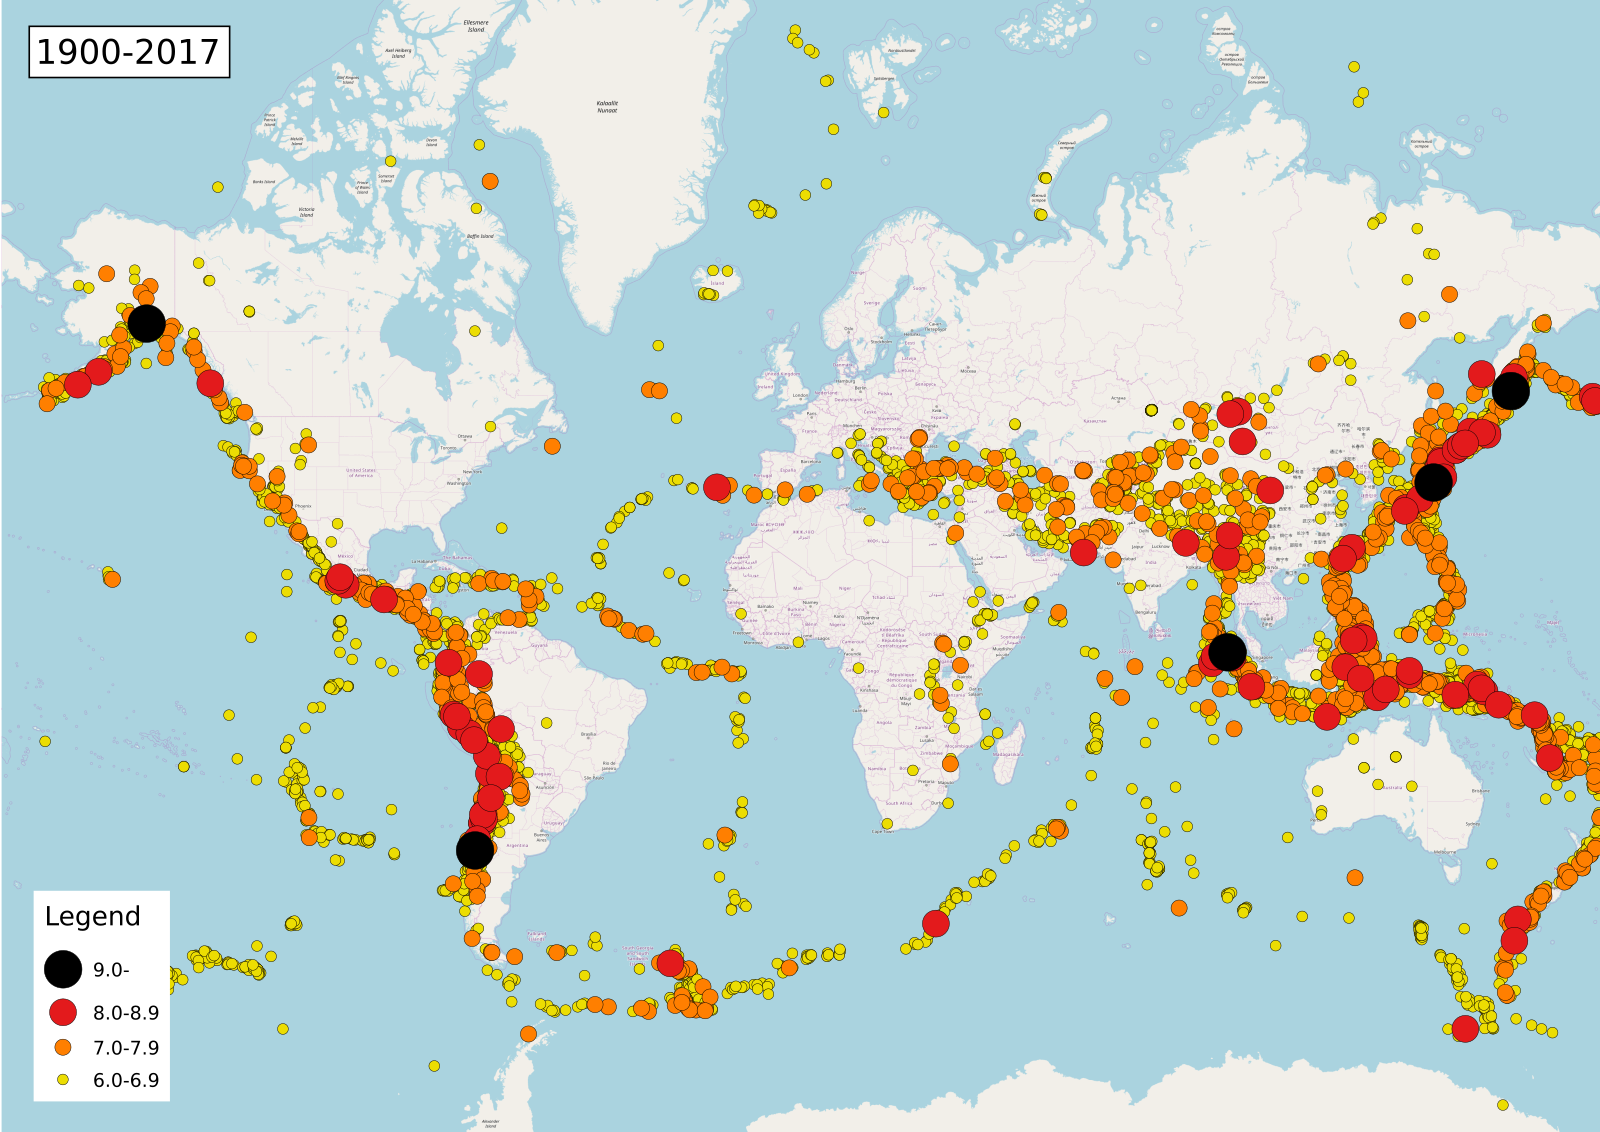
Global map of magnitude ≥ 6.0 earthquakes (1900–2017) showing density along plate margins. Source
This trend highlights the growing human vulnerability to tectonic hazards even if fatalities have not risen proportionally.
Key contributing factors:
Expansion of megacities in seismic zones (e.g. Tokyo, Istanbul, Jakarta)
Migration into marginal and high-risk areas
Disruption of water, sanitation, healthcare, and shelter infrastructure during disasters
Disaster: A hazard event that causes significant disruption to a community’s normal functioning, exceeding its capacity to cope using its own resources.
Economic Damage Trends
There has been a marked increase in the economic cost of tectonic disasters over time, especially since the 1980s.
This increase reflects both rising asset values and greater economic exposure in hazard-prone regions.
High-income countries may suffer greater monetary losses due to the high value of infrastructure, even if the number of casualties is relatively low.
Notable examples:
2011 Tōhoku earthquake and tsunami (Japan): over US44 billion in losses despite relatively few deaths.
Trends indicate:
Disasters in wealthier nations tend to show lower mortality but higher economic cost
In developing countries, the inverse is often true: high mortality but lower financial losses, due to less infrastructure and economic development
Interpreting Tectonic Disaster Data
Issues with Data Reliability
Understanding trends in tectonic disasters is complicated by the reliability and accuracy of the available data.
Challenges include:
Inconsistent definitions: What qualifies as "affected" can vary across organisations and governments.
Underreporting: In remote or politically unstable regions, accurate data may be unavailable or deliberately altered.
Historical data gaps: Records before digital archiving were often incomplete or lost.
Economic valuation: Differences in how countries assess and report economic losses (market value, insurance payouts, or GDP impact) create inconsistencies.
Hazard Risk Equation: Risk = Hazard × Vulnerability ÷ Capacity to Cope
One implication is that comparing disasters across time periods or countries can be misleading without contextual understanding.
Factors Affecting Trends in Impact
The three categories of impact (deaths, affected populations, and economic losses) are shaped by physical, social, and economic variables.
Physical factors:
Magnitude and depth of the event
Proximity to population centres
Type of hazard (e.g. tsunamis generally affect more people over a larger area)
Social and economic factors:
Level of development
Governance and effectiveness of planning
Public awareness and education
Resilience and adaptive capacity
Technological advancements have also played a role in shaping trends:
GIS mapping, remote sensing, and real-time warning systems have improved early warning and response
However, these are still unavailable or ineffective in many low-income or politically unstable regions
Evaluating Trends Across Time
Important observations when evaluating long-term trends:
Short-term spikes in data (due to mega-disasters) may hide underlying patterns
There is a growing gap in resilience between developed and developing nations
While early warning and preparedness have improved globally, exposure and vulnerability remain critical challenges
Key takeaways:
The overall number of tectonic disasters has not significantly increased, but their impact has diversified and often worsened in some regions.
Long-term data shows clearer increases in affected populations and economic damage than in deaths.
Data accuracy remains an obstacle, and this must be addressed when analysing global patterns.
Practice Questions
Question 1 (3 marks)
Outline one reason why economic losses from tectonic disasters have increased since 1960.
Mark Scheme:
1 mark for identifying a relevant reason, up to 2 additional marks for explanation or development.
1 mark – Rising asset values in hazard-prone areas
+1 mark – As countries develop, infrastructure and buildings become more expensive to replace
+1 mark – Even with lower casualties, developed countries face high repair and rebuilding costs after disasters
Question 2 (6 marks)
Explain how trends in deaths and affected populations from tectonic disasters have changed since 1960, and suggest reasons for these changes.
Mark Scheme:
Award up to 6 marks for a balanced answer covering both trends and reasons.
1–2 marks – Basic description of trends (e.g. fatalities have not decreased significantly, number of affected people has increased)
3–4 marks – Some explanation (e.g. improved emergency response in developed countries; urban growth and settlement in hazard-prone areas)
5–6 marks – Clear explanation with detail and linked reasoning (e.g. growth of megacities in seismic zones, uneven development, better disaster preparedness in high-income countries, but ongoing vulnerability in low-income regions)
Max 6 marks for coherent, structured response with at least one developed reason for each trend.
FAQ
Over time, improvements in technology and international cooperation have led to more accurate and consistent data collection. Earlier records, particularly before the 1980s, were often incomplete or estimated.
The introduction of digital seismographs, satellite monitoring, and standardised disaster databases (e.g. EM-DAT) has increased the reporting of smaller events and affected populations. This can give the impression that disasters are becoming more frequent or severe when, in part, it reflects better reporting.
As a result, trends over time must be interpreted with caution and always consider how definitions, coverage, and data quality have changed.
Lower-income countries often lack the financial and technical capacity to conduct comprehensive damage assessments after a disaster.
Reasons for underestimation include:
Absence of insurance systems to quantify losses
Poor record-keeping of informal economies and infrastructure
Delays or political motives in damage reporting
In contrast, wealthier countries tend to report higher figures because of insured losses and more detailed accounting of property and infrastructure values. Therefore, comparisons between countries can be misleading without considering reporting capability.
Rapid urbanisation, particularly in developing regions, increases the number of people exposed to tectonic hazards.
Key influences include:
Expansion of settlements into marginal or unsafe areas (e.g. unstable slopes, floodplains, near fault lines)
Construction of poorly built housing with low hazard resistance
Densely populated cities amplifying the scale of potential displacement and infrastructure failure
These factors mean that even if hazard frequency remains stable, more people are likely to be affected simply due to where and how they live.
Global inequality shapes how countries experience and respond to tectonic disasters.
Low-income countries often:
Lack resilient infrastructure
Have limited emergency response systems
Depend on international aid for recovery
This makes them more vulnerable to long-term disruption, even from moderate events. Meanwhile, wealthier nations invest in mitigation and insurance, which reduces fatalities and speeds up recovery—despite sometimes experiencing higher economic costs in absolute terms.
Thus, inequality directly affects both immediate impacts and long-term consequences of disasters.
Yes, regions experiencing both tectonic activity and socio-economic vulnerability are most at risk of increasing disaster impacts.
Examples include:
South and Southeast Asia, where population growth and urbanisation intersect with seismic and volcanic risk
The Pacific Ring of Fire, due to its high tectonic activity combined with varying levels of development
Sub-Saharan Africa, where even low-magnitude events can have severe impacts due to weak governance and poor infrastructure
These areas often experience compounding pressures that make long-term trends in deaths, displacement, and economic disruption more severe.
