
IB Syllabus focus:
‘Design values surveys for a defined social group to capture different perspectives on an issue and assess likely impacts; choose appropriate statistical tools and, where useful, use behaviour-time graphs to show lifestyle changes.’
Investigating perspectives through surveys enables Environmental Systems and Societies students to systematically explore how values influence choices, arguments, and potential impacts on sustainability-related issues.
Designing Values Surveys
Purpose of Surveys
Surveys allow researchers to capture perspectives within a defined social group, offering structured insights into how individuals’ values shape their environmental attitudes and behaviours.
Key Steps in Survey Design
Define the social group clearly, ensuring that sample selection represents the population under investigation.
Formulate precise questions that link to the values and perspectives under study.
Choose question types:
Closed questions for quantifiable data (e.g., Likert scales).
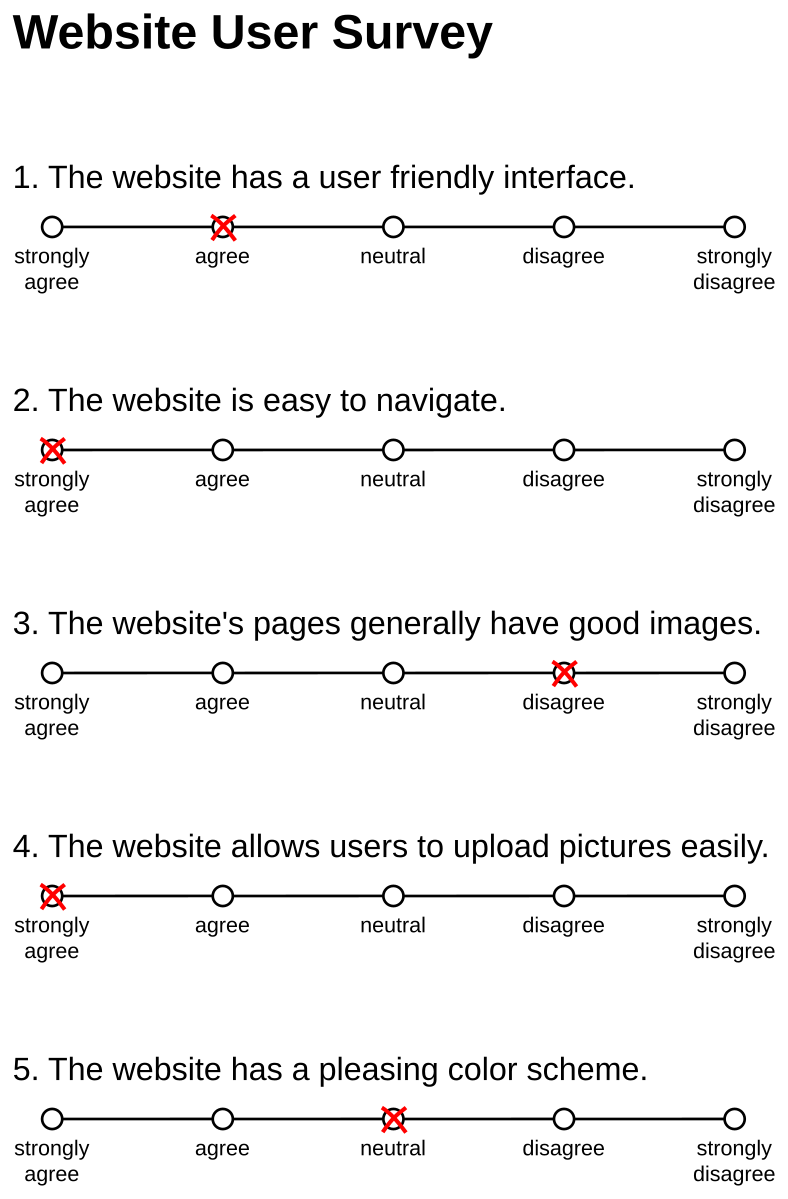
An example of a five-point Likert item with response options from “strongly agree” to “strongly disagree,” suitable for measuring attitudes and values in surveys. The topical statements about Wikipedia are illustrative and go beyond the ESS syllabus but do not alter the generic scale structure. Source.
Open questions for qualitative insights.
Pilot testing ensures clarity, reliability, and validity before large-scale distribution.
Ethical considerations must be respected, such as anonymity and voluntary participation.
Values and Perspectives
Why Values Matter
Values influence priorities, judgements, and choices, shaping both individual perspectives and collective environmental policies. Surveys expose how values translate into positions and actions.
Values: Deeply held principles or standards that guide individuals’ behaviours, decisions, and perspectives.
Linking Values to Perspectives
Normative influences: cultural traditions or social norms.
Scientific influences: evidence-based reasoning.
Economic influences: cost–benefit considerations.
Personal experiences: lived realities shaping individual views.
Capturing Different Perspectives
Representing Social Diversity
Surveys must accommodate contrasting perspectives, ensuring inclusion of diverse demographics, income levels, cultural backgrounds, and political affiliations. This avoids bias and strengthens findings.
Conflicting Values
Some respondents may emphasise technological solutions (technocentric).
Others may prioritise human benefits (anthropocentric).
Others may emphasise intrinsic value of nature (ecocentric).
These overlapping perspectives can be compared systematically through survey data.
Statistical Tools for Analysis
Choosing Tools Appropriately
Once surveys are completed, statistical tools transform raw responses into meaningful insights.
Descriptive statistics: mean, median, mode for summarising results.
Frequency distributions: useful for comparing response categories.
Cross-tabulations: showing relationships between demographic factors and perspectives.
Correlation analysis: assessing links between values and behaviours.
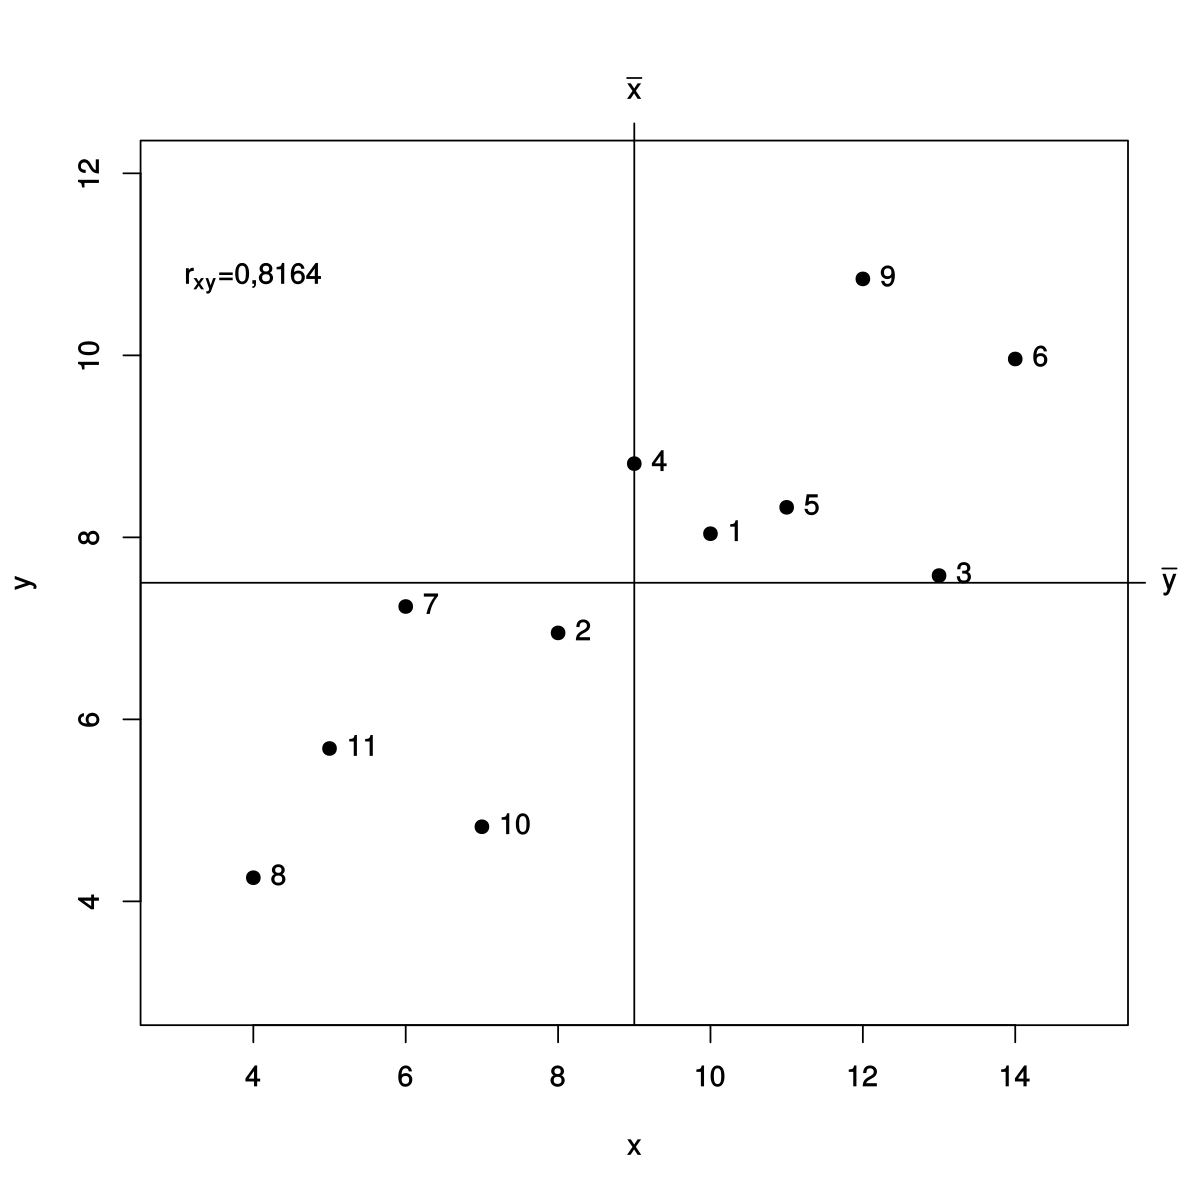
A set of labelled scatter plots (Anscombe-style) illustrating different correlation patterns with axes clearly marked—useful for understanding when survey variables co-vary and how strongly. The specific dataset example is not required by the syllabus but provides a concise visual of correlation concepts. Source.
Correlation: A statistical measure that expresses the strength and direction of a relationship between two variables.
Statistical choice depends on data type (nominal, ordinal, interval) and research aims.
Behaviour-Time Graphs
Purpose
Behaviour-time graphs illustrate changes in lifestyle or behaviour over time, often linked to shifts in values or societal influences.
Behaviour-Time Graph: A visual representation showing how a behaviour or lifestyle choice changes across a specific time period.
Applications in Environmental Studies
Decline in meat consumption linked to rising environmental awareness.
Increase in recycling rates following policy interventions.
Reduction in plastic use after media campaigns.
Interpreting Graphs
Axes: time on the x-axis, behaviour frequency/intensity on the y-axis.
Trends: steady change, sudden shifts, or cyclical patterns.
Impacts: connect observed behavioural shifts to policy outcomes or value transformations.
Assessing Likely Impacts
Predictive Insights
Survey findings, supported by statistics and behaviour-time graphs, help predict future outcomes of current values and perspectives.
Policy impacts: whether public support exists for environmental legislation.
Lifestyle impacts: likelihood of long-term shifts in daily practices.
Social impacts: potential for conflict or cooperation between groups.
Example Applications
Understanding public readiness to adopt renewable energy policies.
Assessing community willingness to support sustainable transport initiatives.
Identifying resistance to environmental regulations due to economic priorities.
Limitations of Surveys
Potential Weaknesses
Response bias: participants may provide socially desirable answers.
Sampling errors: misrepresenting the wider group through poor design.
Oversimplification: survey questions may not fully capture complex values.
Cultural context: interpretations of questions may differ between groups.
Surveys must therefore be combined with other tools such as interviews, case studies, and long-term observation for greater accuracy.
Integrating Methods for ESS
Holistic Approaches
In Environmental Systems and Societies, surveys, statistical analysis, and behaviour-time graphs are mutually reinforcing tools. Together they provide:
Quantitative measurement of values and perspectives.
Qualitative insights into underlying motivations.
Visual evidence of temporal change in behaviours.
This triangulation strengthens understanding of how values shape environmental arguments and potential impacts on sustainability.
Practice Questions
Question 1 (2 marks)
Define what is meant by a behaviour-time graph and state one way it can be used in Environmental Systems and Societies research.
Mark scheme:
1 mark for correct definition: a visual representation showing how a behaviour or lifestyle choice changes across a specific time period.
1 mark for one valid use, such as: showing trends in lifestyle changes, linking behaviours to shifts in values, or illustrating policy impacts.
Question 2 (5 marks)
Discuss how surveys can be used to investigate values and perspectives within a defined social group. In your answer, consider both the design of the survey and the analysis of the results.
Mark scheme:
Up to 2 marks for describing the design process (e.g., defining the social group, selecting question types such as Likert scales, ensuring clarity and ethics).
Up to 2 marks for explaining how data can be analysed (e.g., use of descriptive statistics, correlation analysis, frequency distributions).
1 mark for linking the survey process to capturing perspectives and predicting likely impacts.
Award marks for coherent explanation and accurate use of terminology.
FAQ
Survey bias can occur when questions are phrased in a way that leads participants toward a particular response, or when certain groups are underrepresented.
Common types of bias include:
Leading questions: wording that implies a correct answer.
Sampling bias: not reflecting the full diversity of the social group.
Social desirability bias: respondents answer in ways they think are acceptable rather than truthful.
These issues can reduce reliability and make findings less generalisable.
Sample size influences how representative the results are.
Small samples may only reflect the perspectives of a few individuals, limiting wider application.
Larger samples increase reliability by reducing the effect of outliers.
In IB-level research, practical limitations often restrict size, so clarity in defining the social group is essential to maintain validity.
Likert scales capture degrees of agreement or disagreement, allowing nuanced measurement of attitudes.
They provide ordinal data, useful for identifying patterns.
Responses can be converted into quantitative values for statistical analysis.
They reveal not just whether a respondent agrees, but how strongly they hold that view, offering more depth than simple yes/no questions.
Misinterpretation often arises when trends are taken at face value without considering context.
Correlation may be assumed to imply causation.
External factors, such as new laws or campaigns, may not be shown in the graph but strongly influence behaviours.
Short time spans can exaggerate fluctuations, whereas long spans may obscure rapid changes.
Careful annotation and contextual analysis help avoid these pitfalls.
Ethical practice ensures participants’ rights and wellbeing are protected.
Informed consent: participants must know the purpose of the survey.
Confidentiality: responses should remain anonymous where possible.
Avoiding harm: questions must not cause distress or discrimination.
Voluntary participation: individuals should never feel pressured to take part.
Ethics not only protect respondents but also improve the credibility of research outcomes.
