
IB Syllabus focus:
‘Scarcity: limited water or infrastructure. Water stress includes quality, environmental flows and access; <1,700 m³ per person per year indicates stress.’
Water scarcity and water stress represent two critical yet distinct challenges shaping global water security. Understanding their thresholds helps societies plan sustainable management strategies in a rapidly changing world.
Distinguishing Scarcity and Stress
Water Scarcity
Water scarcity refers to situations where there is a physical shortage of water resources or insufficient infrastructure to meet human and environmental demands.
Water Scarcity: A condition where available water resources or infrastructure are insufficient to satisfy the needs of a population or ecosystem.
Scarcity often arises in arid or semi-arid regions with low rainfall, but it can also occur in areas with poor water storage, treatment, or distribution systems.
Water Stress
Water stress is a broader concept that includes quantity, quality, and accessibility of water. Stress occurs even when water is physically present but compromised in other ways.
Water Stress: A situation where water availability, quality, or accessibility is inadequate to meet societal, economic, or environmental needs.
Stress can be driven by pollution, over-abstraction, inequitable distribution, or ecological damage that limits environmental flows.
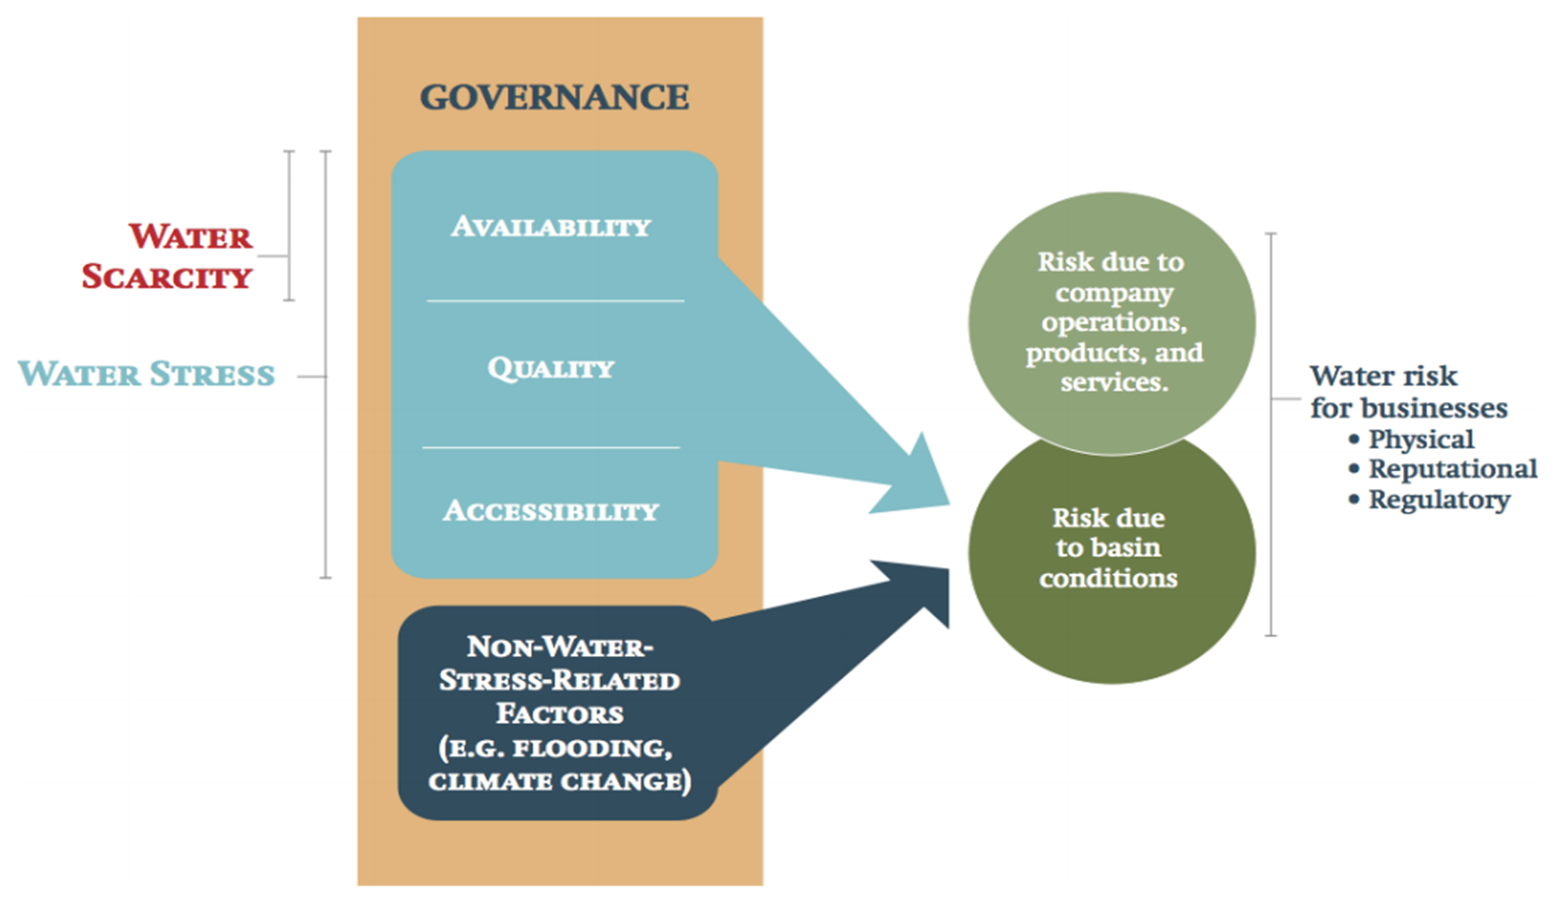
Conceptual diagram contrasting water scarcity (a volumetric availability issue) with water stress (availability, quality and accessibility), and showing how governance modulates outcomes. The right-hand bubbles on “risk” provide extra business-focused context not required by the IB syllabus. Source.
Thresholds and Indicators
Measuring Stress
The per capita water availability threshold is a widely used indicator of water stress.
Less than 1,700 m³ per person per year: Indicates water stress.
Less than 1,000 m³ per person per year: Indicates chronic water scarcity.
Less than 500 m³ per person per year: Suggests absolute scarcity, with severe implications for health, food security, and development.
This threshold-based classification helps policymakers evaluate risk levels and plan water allocation.
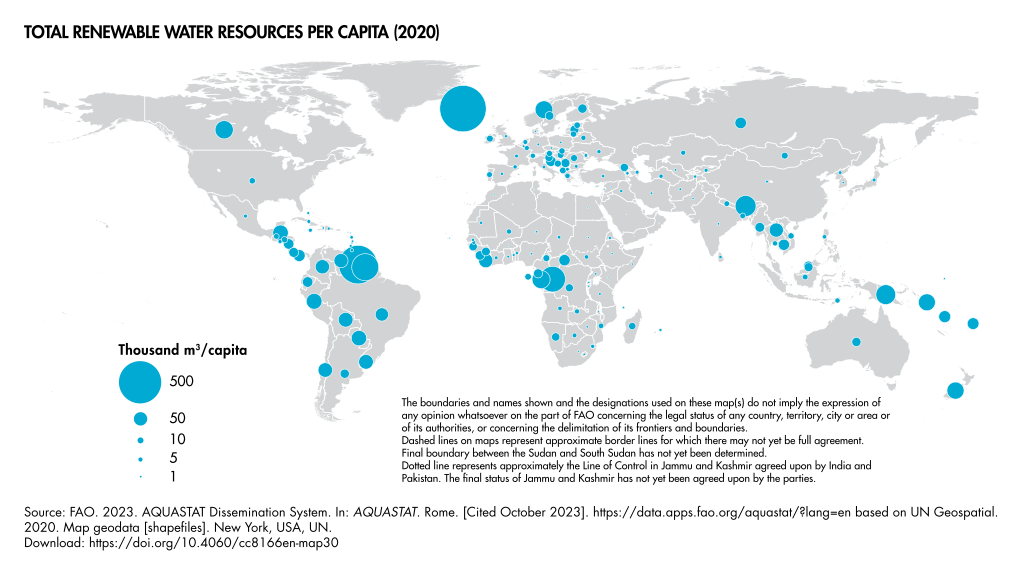
Caption: Map of renewable water resources per capita by country (2020), suitable for applying the Falkenmark thresholds to identify stress, scarcity and absolute scarcity. Colour classes show relative availability; use your thresholds for interpretation. Source.
Factors Affecting Thresholds
Threshold values are averages, but local variation matters:
Countries may have abundant national water resources, but regions within them may face severe stress.
Climate variability, seasonal rainfall, and groundwater depletion affect real availability.
Population density alters per capita figures, pushing areas into higher stress categories.
Causes of Scarcity and Stress
Natural Drivers
Low rainfall and droughts reduce recharge of rivers and aquifers.
Seasonal variability concentrates shortages during dry periods.
Climate change intensifies hydrological extremes, worsening both scarcity and stress.
Human Drivers
Population growth increases demand for domestic, industrial, and agricultural water.
Agriculture (particularly irrigation) consumes about 70% of global freshwater, leading to competition.
Pollution from fertilisers, sewage, and industry reduces water quality, raising stress levels.
Infrastructure limitations in developing countries create scarcity despite physical availability.
Implications for Societies
Health and Well-being
Scarcity reduces access to safe drinking water, increasing disease risk.
Stress compromises sanitation, leading to higher rates of diarrhoeal illnesses.
Economic Impacts
Agriculture suffers from reduced irrigation supply, threatening food security.
Industries dependent on clean water, such as textiles and pharmaceuticals, face rising costs.
Hydropower generation declines in drought-prone regions.
Environmental Consequences
Over-abstraction lowers river flows, harming aquatic ecosystems.
Reduced groundwater recharge leads to land subsidence and saline intrusion.
Stress on ecosystems undermines biodiversity and natural water purification services.
Managing Scarcity and Stress
Supply-Side Measures
Reservoirs and dams to store water during wet periods.
Desalination in water-poor coastal regions.
Groundwater recharge through artificial methods.
Demand-Side Measures
Water metering to reduce waste in households.
Drip irrigation and other efficient farming techniques.
Greywater reuse in urban systems.
Policy and Governance
Integrated Water Resources Management (IWRM) coordinates water use across sectors.
Equity-focused policies ensure vulnerable groups access safe water.
International agreements on transboundary rivers reduce conflict over shared resources.
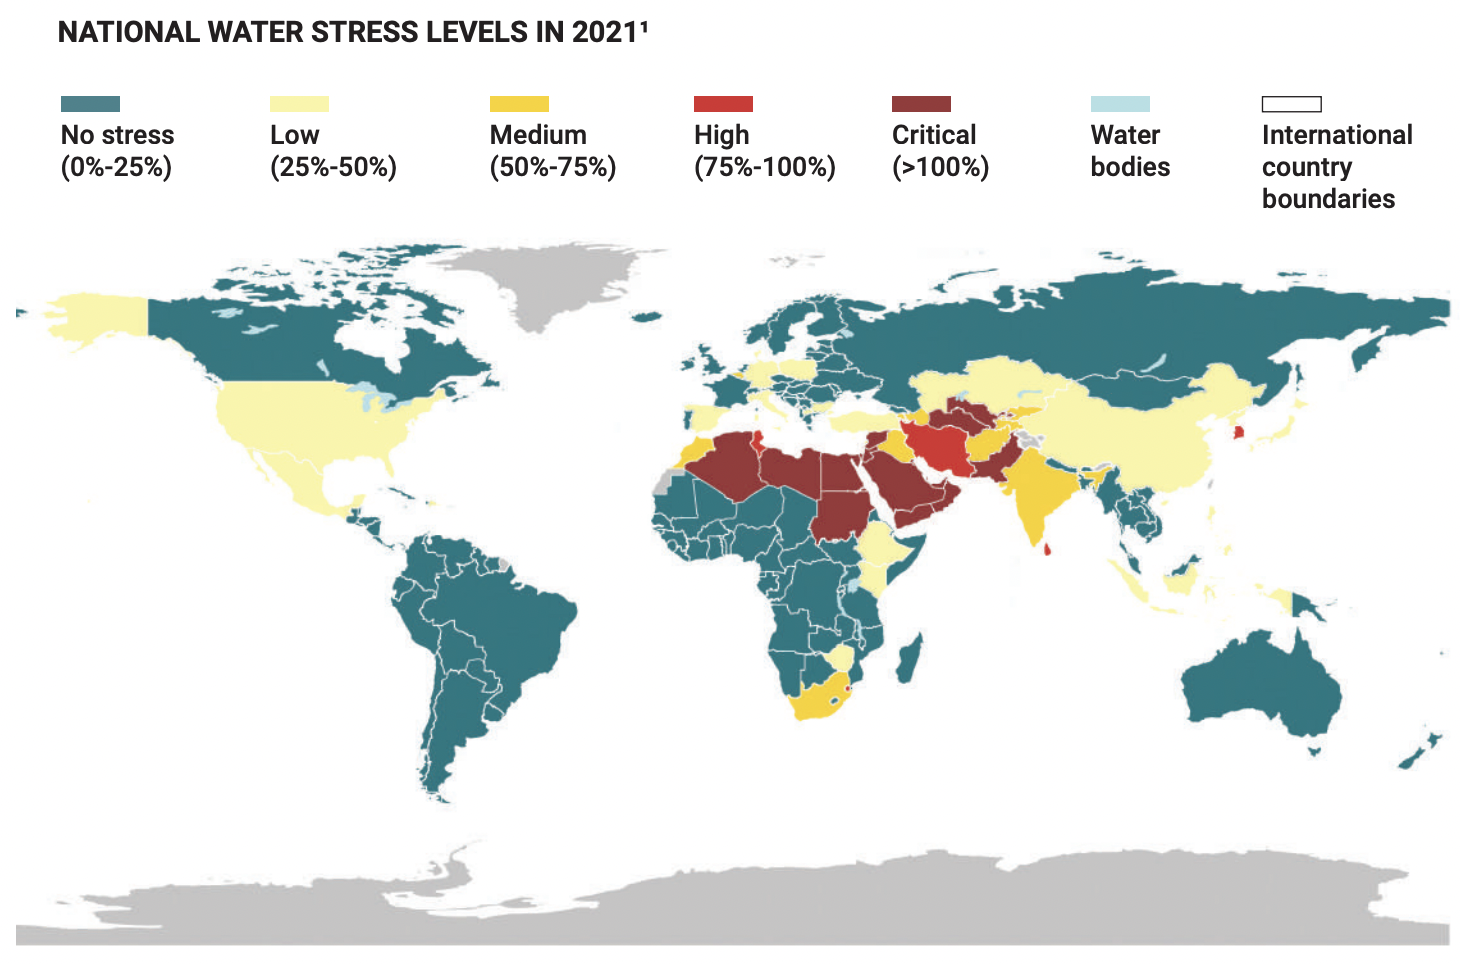
UN-Water/FAO map of national water stress levels (2015–2021), defined as withdrawals ÷ (renewable resources − environmental flow requirements). This shows where human demand places significant pressure on water supplies—an approach complementary to per-capita thresholds. Source.
Key Takeaways
Scarcity emphasises physical shortage or infrastructure gaps.
Stress accounts for quality, environmental flows, and access.
The <1,700 m³ per person per year threshold marks global recognition of stress.
Human activity and climate change intensify both scarcity and stress, demanding sustainable and equitable water governance.
Practice Questions
Question 1 (2 marks)
Define water scarcity and water stress, highlighting the difference between the two terms.
Mark Scheme:
1 mark for correctly defining water scarcity as a physical shortage of water or inadequate infrastructure.
1 mark for correctly defining water stress as including availability, quality, and accessibility, not just shortage.
Question 2 (5 marks)
Explain how the use of thresholds (such as per capita water availability) can help assess water scarcity and stress. Discuss one limitation of using these thresholds.
Mark Scheme:
Up to 2 marks for describing the use of thresholds, e.g. <1,700 m³ per person per year = stress, <1,000 m³ = scarcity, <500 m³ = absolute scarcity.
Up to 2 marks for explaining how thresholds allow comparisons between countries or regions, supporting planning and management decisions.
1 mark for recognising a limitation, e.g. thresholds are averages and do not account for seasonal variability, uneven distribution, or quality issues.
FAQ
This threshold was first introduced by Malin Falkenmark, a Swedish hydrologist, in the 1980s. Her framework linked per capita renewable water resources to societal outcomes, such as food production and economic development.
The <1,700 m³ figure became a widely used benchmark for stress, while <1,000 m³ indicated scarcity and <500 m³ absolute scarcity. These values remain influential in global water assessments.
Water stress accounts for factors beyond total volume, such as:
Quality of water, which may be degraded by pollution.
Accessibility, including infrastructure for distribution.
Environmental flows, ensuring ecosystems retain enough water.
This broader approach highlights that even areas with abundant water can face stress if these conditions are compromised.
Rising populations reduce per capita water availability even if total supply remains constant.
Urbanisation intensifies demand in concentrated areas, requiring significant infrastructure for storage, treatment, and distribution. Without these systems, stress can appear at higher thresholds than predicted by national averages.
Thresholds based on annual averages may obscure seasonal extremes.
For example, a region might exceed 1,700 m³ per person per year overall, but still experience acute summer shortages. Prolonged droughts or shifts in rainfall patterns can also push regions temporarily into scarcity conditions, making thresholds less reliable without climate data.
Governments employ thresholds to:
Identify regions at risk of shortages.
Prioritise investment in infrastructure like dams or treatment plants.
Support international negotiations on shared rivers and aquifers.
However, they often combine thresholds with other indicators, such as water quality indices or withdrawal-to-availability ratios, for a fuller picture.

.svg)