
IB Syllabus focus:
‘Footprints quantify water use by people, nations, crops, livestock and products, informing decisions on security and sustainability.’
Water is essential for life, economies, and ecosystems, but its distribution is highly uneven. Water footprints provide a structured way to understand human demand and guide sustainable management.
Understanding Water Footprints
The concept of a water footprint was developed to measure the total volume of freshwater used directly and indirectly to produce goods and services consumed.
Water footprint: The total volume of freshwater used to produce the goods and services consumed by an individual, community, or nation, including direct and indirect use.
A water footprint is broader than simple household water use. It includes the hidden water embedded in food, clothing, and industrial products. This makes it a powerful tool for planning water security and sustainability strategies.
Components of Water Footprints
Water footprints are divided into three main categories:
Blue water footprint: Volume of surface and groundwater consumed (for irrigation, domestic, or industrial use).
Green water footprint: Volume of rainwater stored in soil and used by plants for growth.
Grey water footprint: Volume of freshwater required to assimilate pollutants and maintain water quality within agreed standards.
Grey water footprint: The amount of water required to dilute pollutants so that water quality remains within safe limits.
By combining these categories, planners can build a holistic picture of how human activity interacts with freshwater systems.
The water footprint has three components: green, blue and grey.
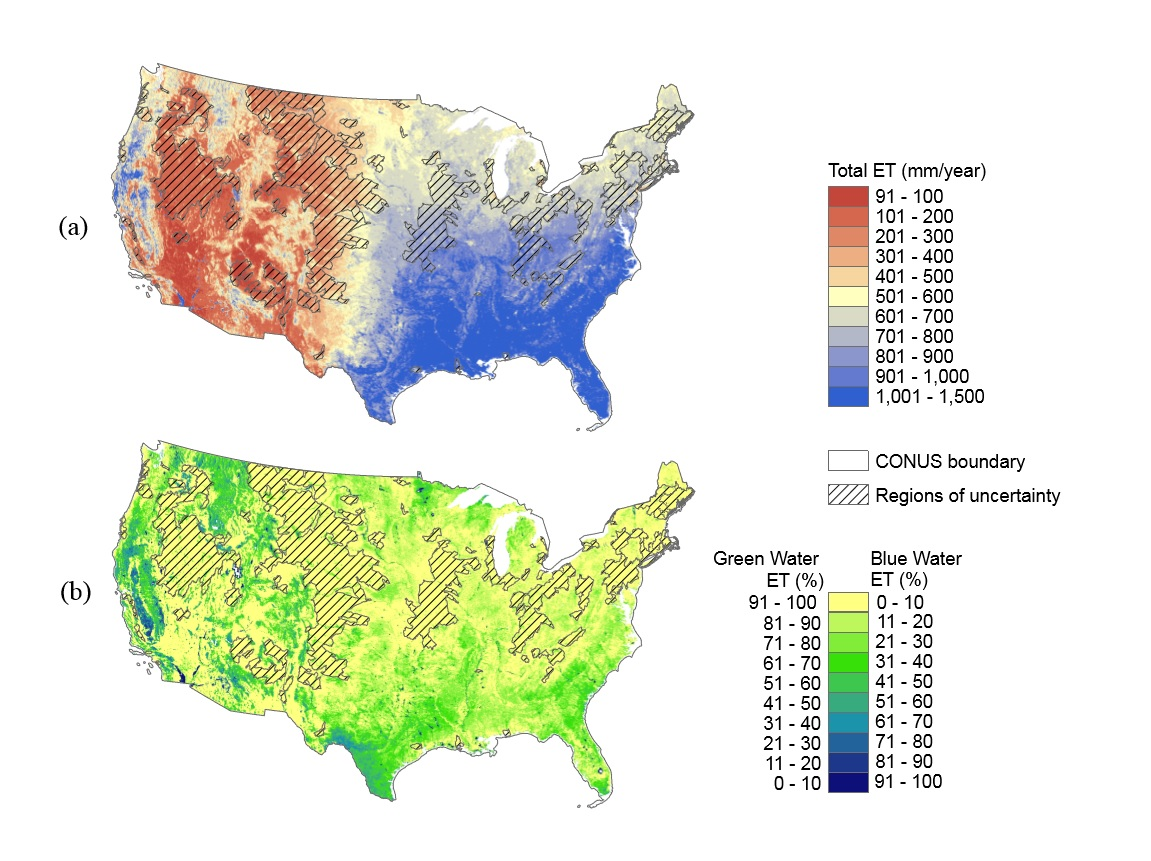
Illustration contrasting green water (rainfall stored in soil and transpired/evaporated by crops) with blue water (surface/groundwater applied via irrigation) and their evapotranspiration pathways. This helps students visualise component sources before linking them to water footprints; grey water is not shown in this figure. Source.
Scales of Measurement
Water footprints can be applied at different scales:
Individual and Household
Household water meters capture direct use, but food and clothing dominate hidden consumption.
For example, producing 1 kg of beef can require thousands of litres of water, highlighting the importance of diet choices.
National and Regional
Nations calculate their per capita water footprint to track sustainability.
Countries with high agricultural exports often carry large water footprints linked to irrigation-intensive crops.
Importing and exporting goods means countries also exchange “virtual water.”
Virtual water: The hidden flow of water when commodities, food, or goods are traded from one region to another.
Product and Industrial
Products can be labelled with their water footprint, helping consumers make informed choices.
Industries assess water footprints to evaluate efficiency and reduce environmental impacts.
Footprints quantify water use by people, nations, crops, livestock and products, informing decisions on security and sustainability.
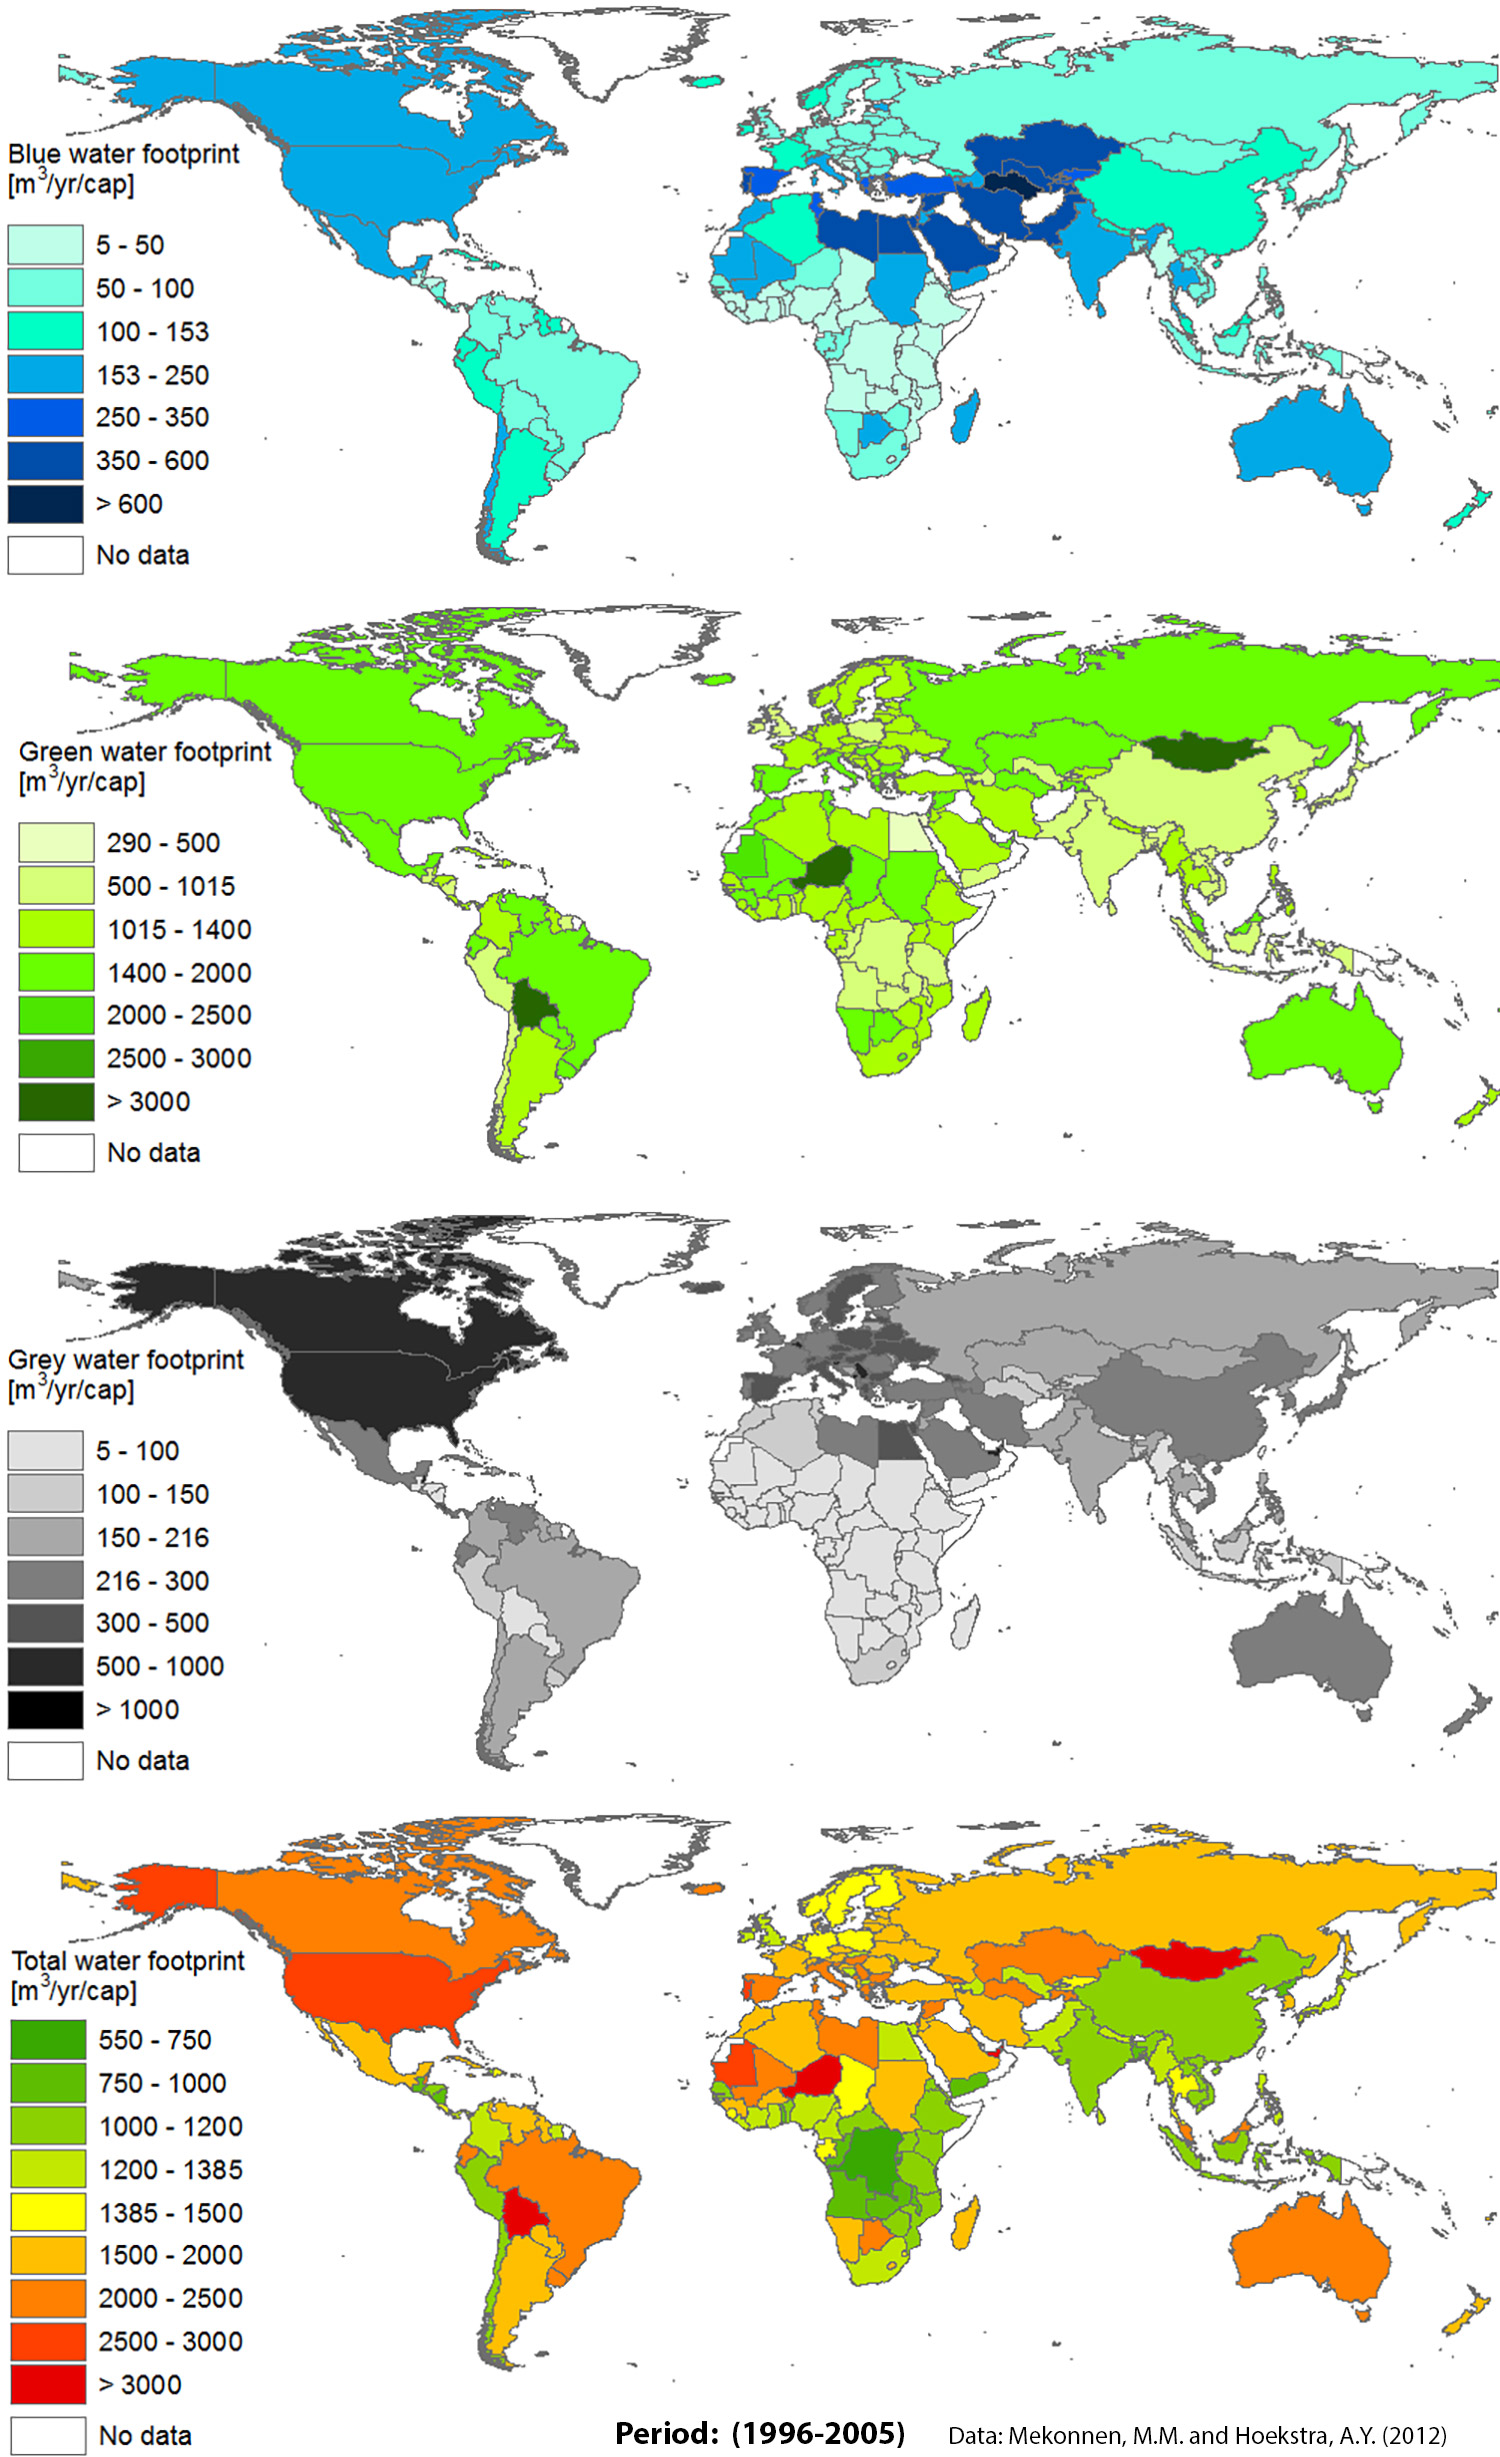
World map comparing countries’ per-capita water footprints split into green (rain-fed), blue (surface/groundwater), and grey (pollution assimilation) components. Such decomposition helps planners see both consumption patterns and pollution pressures across regions. Source.
Role in Water Security and Sustainability
The IB syllabus requires students to understand how water footprints inform decisions about security and sustainability. These insights are vital for:
Planning equitable allocation of water between agriculture, industry, and households.
Identifying unsustainable practices, such as overreliance on blue water irrigation in arid regions.
Reducing risk of conflicts over transboundary rivers and aquifers.
Guiding conservation policies, such as promoting drought-resistant crops or water-efficient production systems.
Sectoral Applications
Agriculture
Agriculture accounts for about 70% of global freshwater withdrawals.
Drip irrigation and crop selection reduce blue water footprints.
Shifting diets toward lower water-demand foods reduces national footprints.
Industry
Industrial processes often generate a large grey water footprint due to pollution.
Cleaner production methods and wastewater treatment can shrink footprints.
Households
While smaller in scale compared to agriculture, household choices (low-flow taps, greywater reuse, rainwater harvesting) demonstrate how local action contributes to national sustainability.
Water Footprints in Global Planning
International organisations and governments increasingly use water footprints in planning:
Comparisons across countries reveal hotspots of unsustainable use.
Policy tools such as taxes, trade restrictions, or subsidies can address inefficient or polluting production.
Citizen awareness campaigns encourage more sustainable consumer behaviour.
Limitations and Criticisms
While water footprints are useful, they also face challenges:
Data uncertainty: Estimating indirect water use can be complex.
Regional variation: Water scarcity impacts differ widely depending on local ecosystems.
Equity issues: Wealthier nations may shift large water footprints abroad by importing water-intensive goods.
Nevertheless, despite these limitations, the concept remains vital for integrated water resource management.
Linking to Systems Thinking
As with all IB Environmental Systems and Societies topics, water footprints are best understood as part of a system:
Inputs: Rainfall, groundwater, imported virtual water.
Outputs: Agricultural products, industrial goods, wastewater.
Feedbacks: Policies, social behaviours, and international trade influence the balance.
By visualising these interactions, students can see how water footprints connect human activities to environmental limits.
Key Takeaways for Students
Water footprints include blue, green, and grey categories.
They apply to individuals, products, nations, and industries.
They inform sustainable planning, especially under conditions of water stress.
The concept of virtual water is critical for understanding trade and international equity.
While imperfect, water footprints remain essential for guiding security and sustainability in a changing world.
Practice Questions
Question 1 (2 marks)
Define the term virtual water and explain how it relates to the concept of a water footprint.
Mark Scheme:
1 mark for correct definition of virtual water: the hidden flow of water when commodities, food, or goods are traded from one region to another.
1 mark for explaining its link to water footprints, e.g. virtual water is included in the indirect component of water footprints, showing the embedded water in traded goods.
Question 2 (5 marks)
Discuss how water footprints can be used by governments to plan for sustainable water management at the national level.
Mark Scheme:
Up to 2 marks for describing what a water footprint measures (blue, green, and grey components of water use).
Up to 2 marks for linking water footprints to national planning, e.g. identifying unsustainable agricultural practices, comparing per capita footprints, or highlighting reliance on imported virtual water.
Up to 1 mark for an example of how water footprint data might influence policy (e.g. promoting drought-resistant crops, regulating industrial pollution, or encouraging sustainable consumption).
FAQ
A water footprint measures freshwater consumption and pollution across products, individuals, or nations, while a carbon footprint measures greenhouse gas emissions.
In planning, the water footprint focuses on resource allocation and ecosystem health, while the carbon footprint addresses climate change. Together, they help policymakers balance environmental sustainability.
Food choices have a major influence on personal water footprints. Animal products generally require much more water than plant-based foods.
Beef and lamb have very high blue and green water footprints due to irrigation and feed.
Pulses, grains, and vegetables usually require significantly less water.
Shifting towards plant-based diets can reduce individual water footprints substantially.
The grey water footprint reflects how much water is needed to dilute pollutants. In industrial regions, large volumes of effluent can overwhelm natural systems.
Monitoring grey water footprints allows governments to identify industries contributing most to pollution, regulate wastewater discharges, and enforce quality standards to protect freshwater supplies.
Water footprint data shows not only how much water is consumed but also whether countries depend on virtual water imports.
Wealthier nations often outsource water-intensive production, placing pressure on water-scarce exporting regions. This highlights global inequities where some countries experience environmental stress to supply others.
Water footprints can inform trade discussions by identifying whether exports rely on unsustainable water use.
For example, trade in water-intensive crops from arid countries may be reconsidered if it contributes to overexploitation.
Negotiators can use this information to promote fairer agreements, support sustainable production, and protect vulnerable ecosystems.
