
IB Syllabus focus:
‘Climate reflects typical temperature and precipitation patterns. Anthropogenic CO₂ emissions have risen sharply since the Industrial Revolution, accelerating after 1950 with industrialization and population growth.’
Climate is the long-term pattern of temperature and precipitation across regions. Human-driven emissions, particularly since industrialisation, are disrupting natural balances, accelerating climate change globally.
Understanding Climate Basics
Definition of Climate
Climate: The average long-term weather patterns of temperature, precipitation, humidity, and other atmospheric conditions in a particular region, typically measured over 30 years.
Climate is distinct from weather, which refers to short-term atmospheric conditions. Whereas weather changes daily, climate represents enduring conditions that shape ecosystems, biodiversity, and human societies.
Key Elements of Climate
The major elements that define climate include:
Temperature: Average heat energy in a region, influenced by latitude, altitude, and ocean currents.
Precipitation: The long-term pattern of rainfall or snowfall that determines water availability.
Humidity and atmospheric pressure: Secondary but important factors influencing stability and variability.
These elements combine to form diverse climate zones such as tropical, temperate, arid, and polar regions.
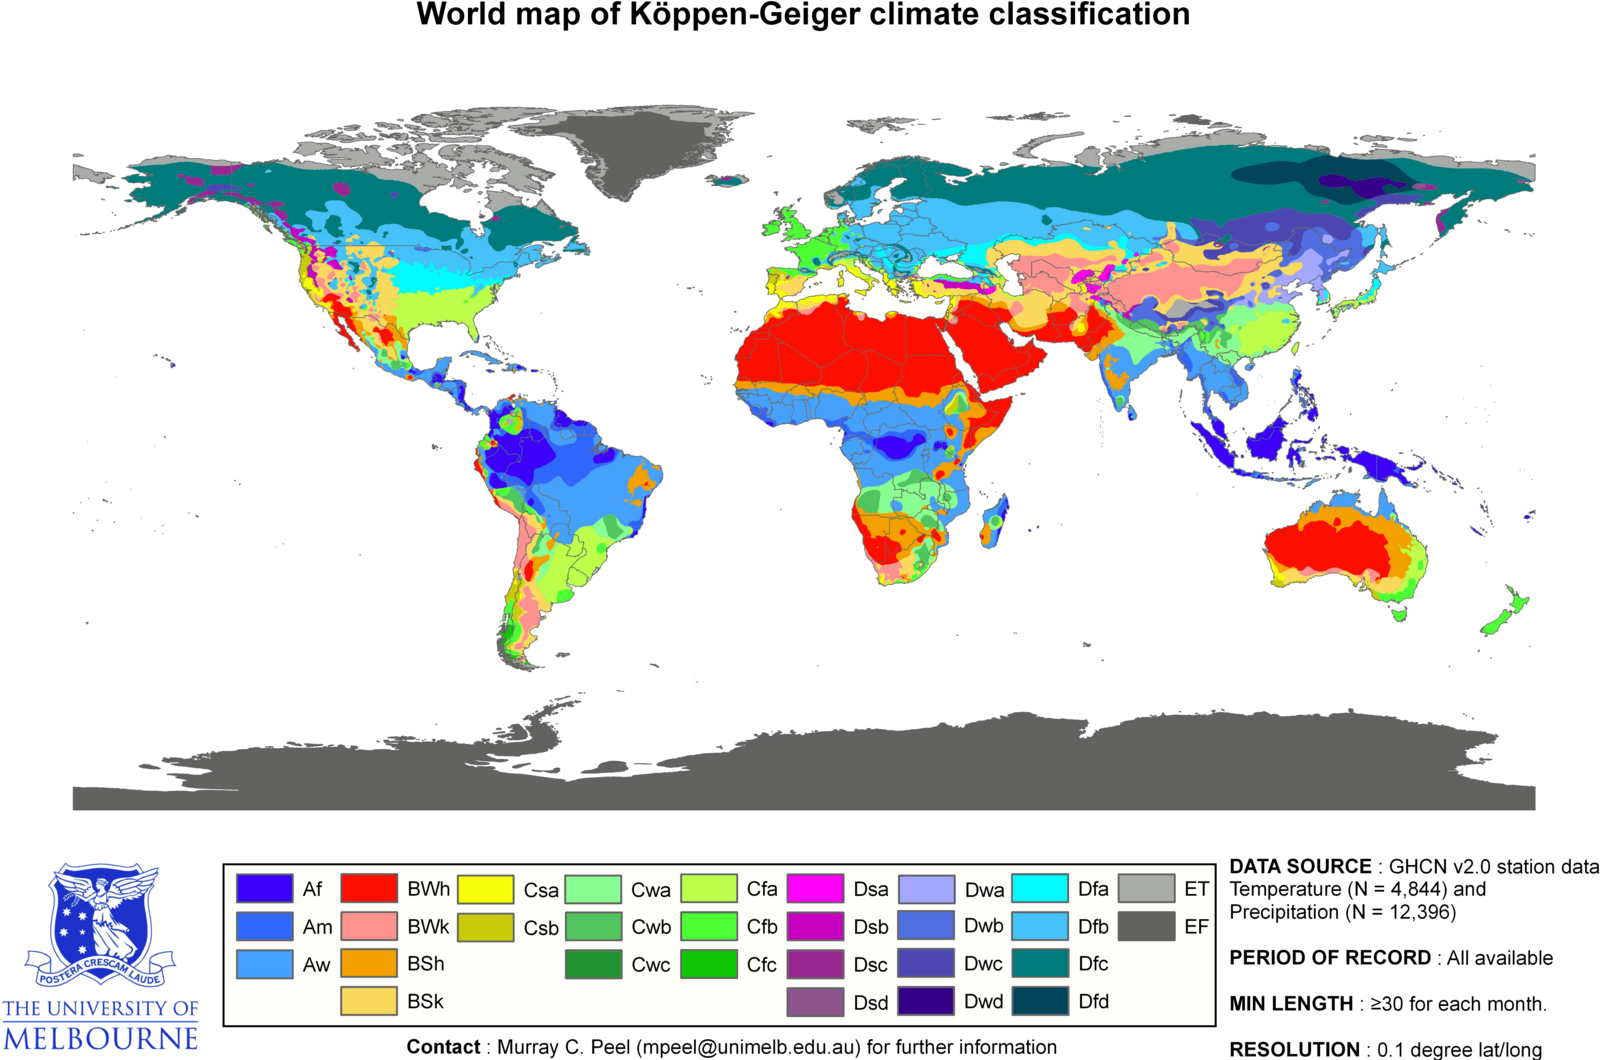
A Köppen–Geiger world map showing major climate zones derived from long-term temperature and precipitation patterns. The map helps relate “climate” to persistent regional regimes rather than day-to-day weather. Sub-types provide extra detail beyond the syllabus requirement. Source.
Historical Context: The Industrial Revolution
Anthropogenic CO₂ Emissions
Before the Industrial Revolution (late 18th century), CO₂ levels in the atmosphere remained relatively stable. The revolution marked a dramatic shift as fossil fuels—coal, oil, and gas—were burned on an unprecedented scale for manufacturing, energy, and transport.
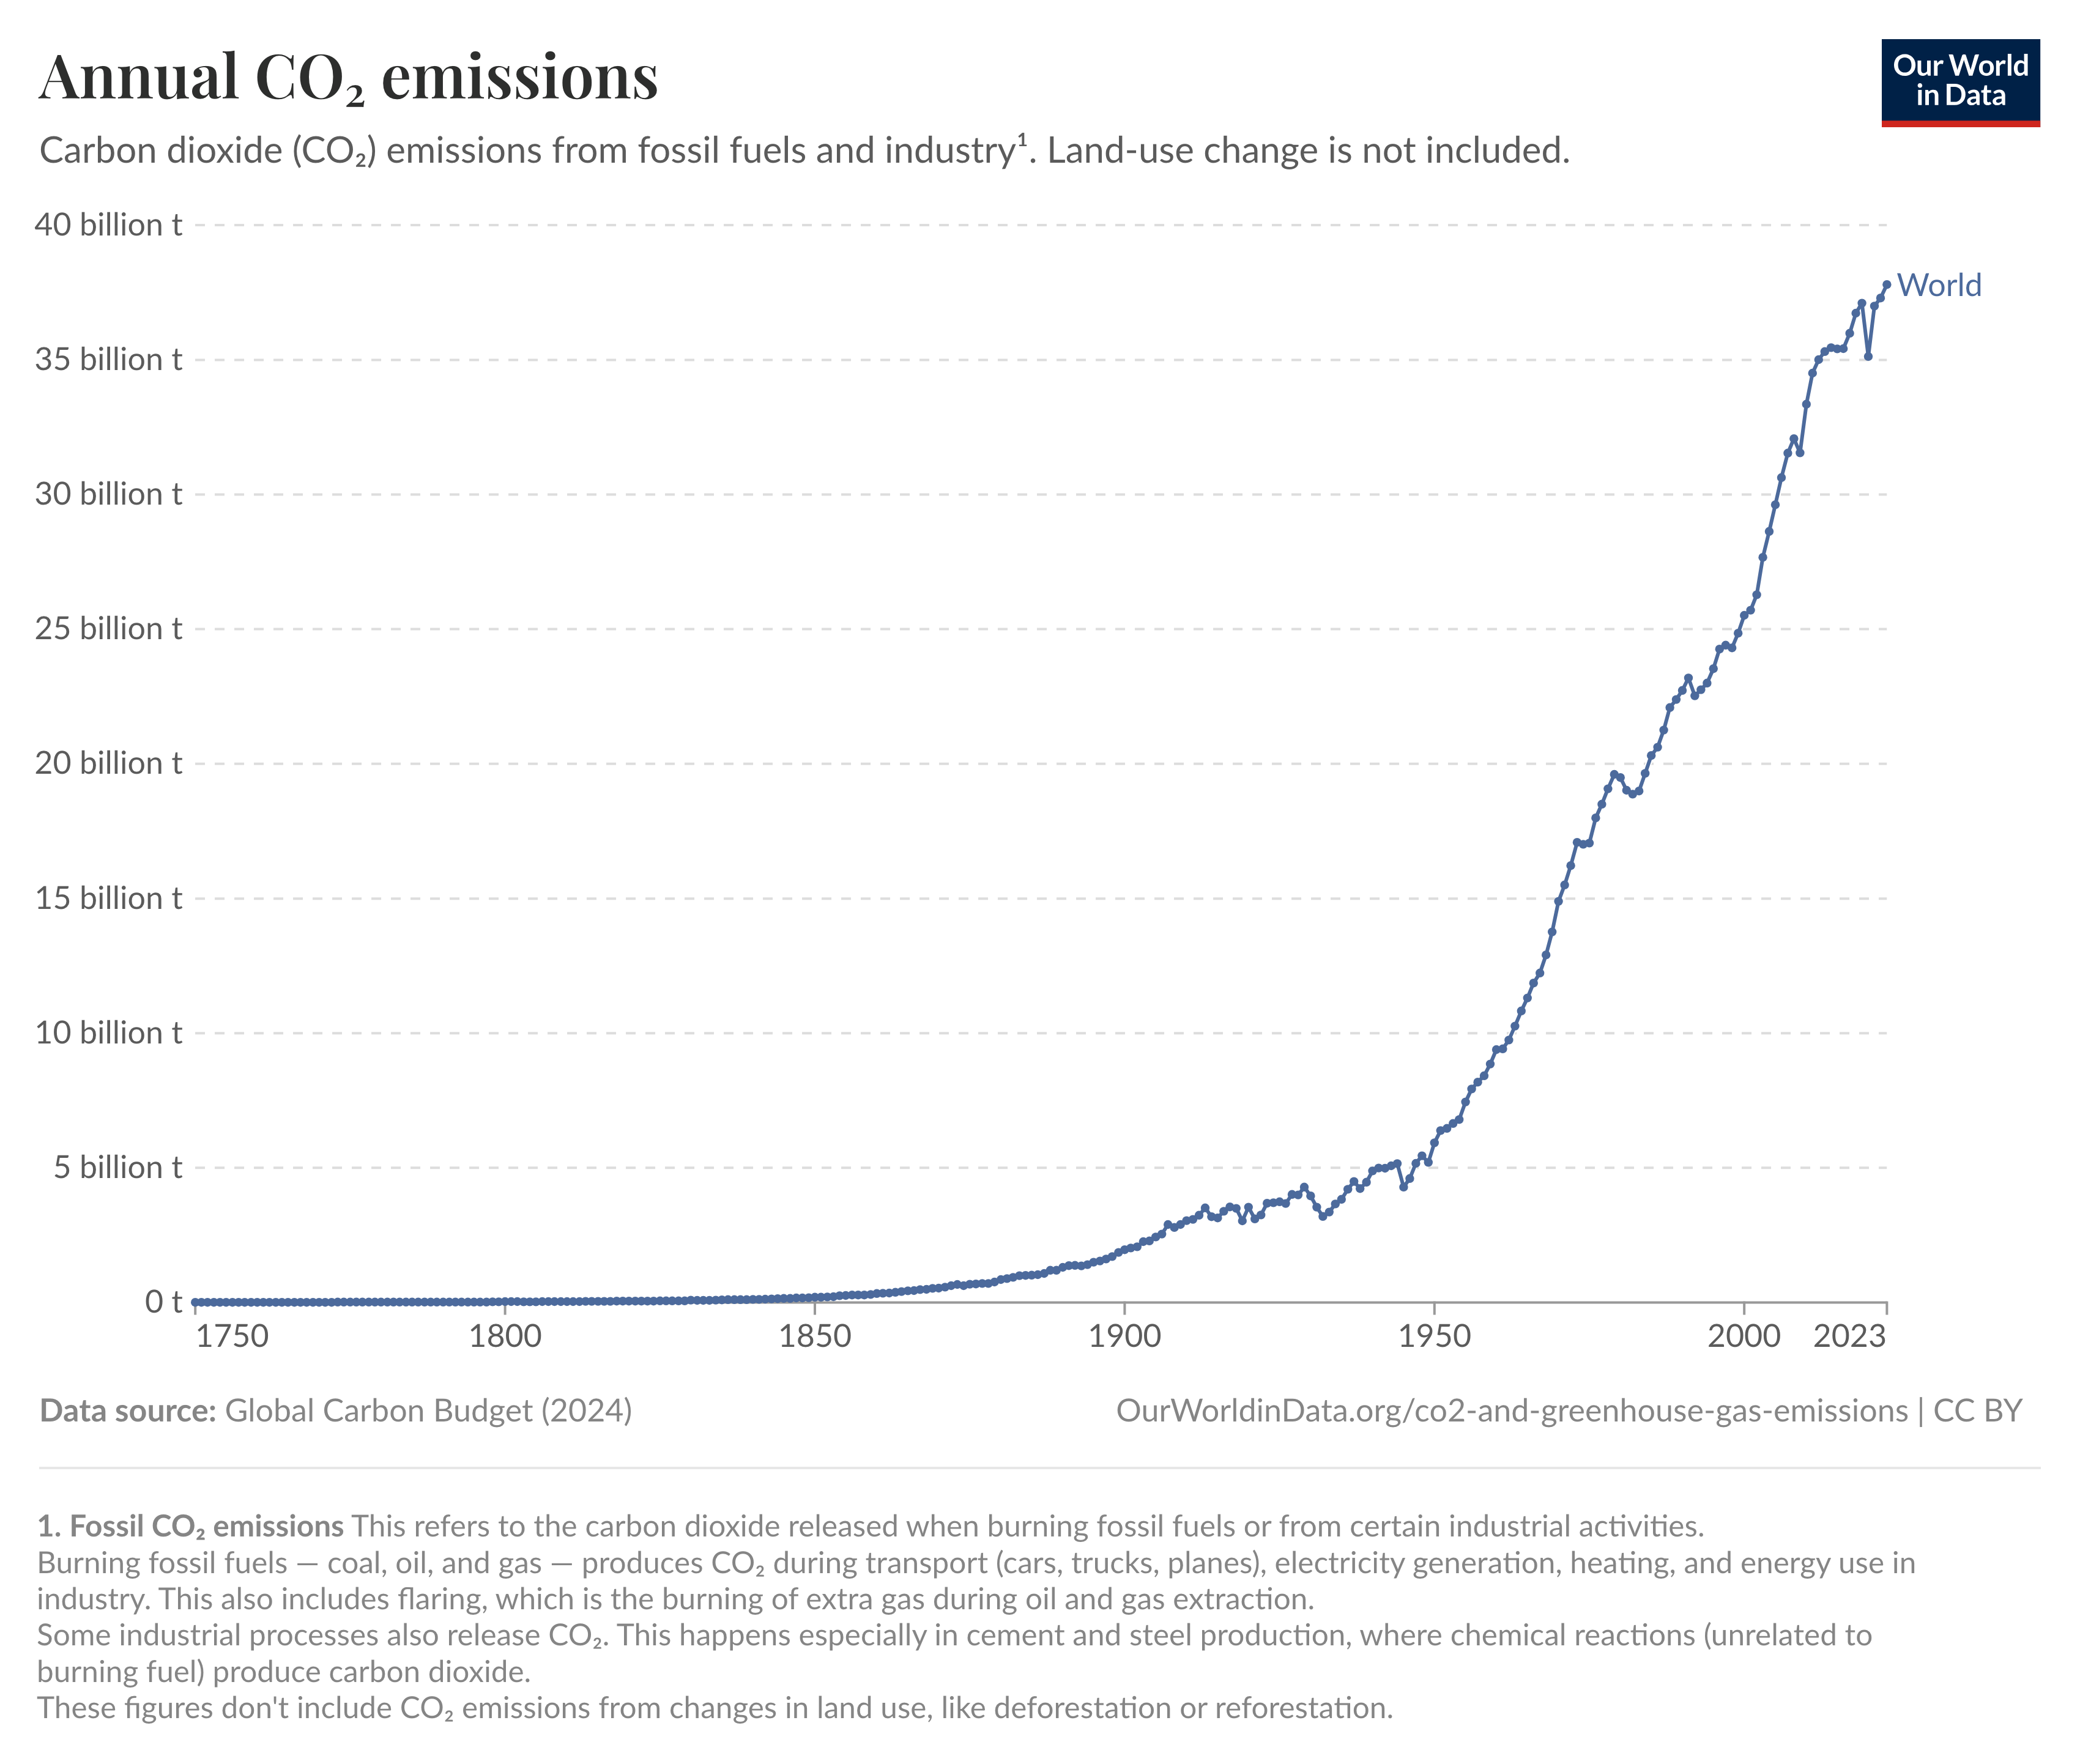
A time-series of global CO₂ emissions from fossil fuels, beginning in 1750, highlighting low pre-industrial emissions, rapid growth with industrialisation, and the post-1950 surge. This complements concentration records (Keeling Curve) by showing emissions—the direct human inputs to the atmosphere. Some panels on the source page discuss regional splits not required here. Source.
Anthropogenic emissions: Emissions of greenhouse gases that originate from human activities, particularly combustion of fossil fuels, agriculture, and land-use change.
The combustion of fossil fuels releases carbon dioxide (CO₂), the most significant long-lived greenhouse gas, into the atmosphere, contributing to the enhanced greenhouse effect.
Post-1950 Acceleration
The period after 1950 saw a marked acceleration in emissions due to:
Rapid industrialisation across developed and later developing nations.
Population growth, leading to higher energy demand and increased agricultural production.
Expansion of transportation networks reliant on petroleum.
Intensification of agriculture, increasing methane (CH₄) and nitrous oxide (N₂O) emissions.
This era is sometimes described as the Great Acceleration, when humanity’s impact on Earth’s systems rapidly expanded.
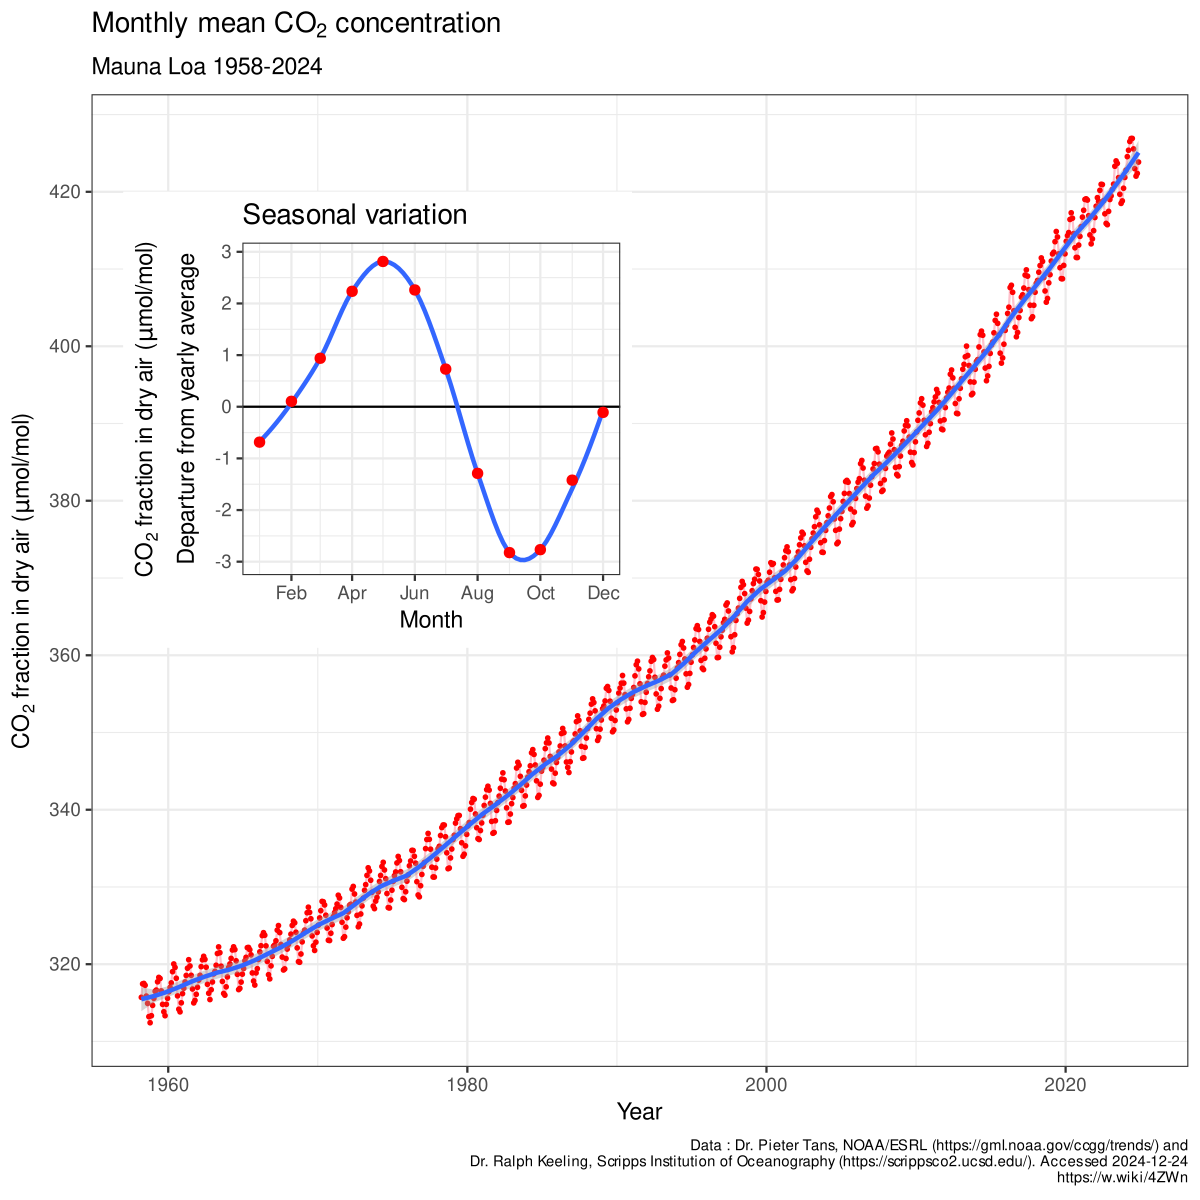
The Keeling Curve plots monthly mean atmospheric CO₂ at Mauna Loa from 1958 to the present, revealing a persistent upward trend with a small seasonal cycle. It provides direct observational evidence for rapidly rising greenhouse gas concentrations since the mid-20th century. The focus here is on CO₂ levels; ancillary references to global drivers are beyond the figure. Source.
The Link Between Emissions and Climate
Greenhouse Gas Dynamics
Greenhouse gases (GHGs) such as CO₂, methane, and nitrous oxide trap outgoing longwave radiation, raising the mean global temperature. The relationship is well-established: as emissions increase, atmospheric concentrations rise, strengthening the greenhouse effect.
Evidence of Rising Emissions
Empirical data shows:
Atmospheric CO₂ levels increased from about 280 ppm (pre-industrial) to over 420 ppm today.
Methane concentrations more than doubled since the pre-industrial era.
Nitrous oxide rose significantly due to synthetic fertiliser use.
These changes correspond with observed increases in global mean surface temperature.
Drivers of Rising CO₂ Emissions
Energy Sector
The largest contributor, responsible for over 70% of global emissions, including:
Burning of coal for electricity.
Oil consumption in transportation.
Gas use for heating and industry.
Agriculture and Land Use
Agricultural practices also contribute significantly:
Rice paddies release methane.
Livestock digestion produces CH₄.
Fertilisers emit nitrous oxide.
Deforestation reduces carbon sinks, amplifying atmospheric CO₂ levels.
Population and Consumption
Population growth has compounded the problem by driving demand for:
Energy-intensive lifestyles.
Urbanisation and infrastructure expansion.
Greater food production, intensifying agriculture’s footprint.
Climate Patterns and Regional Differences
Influence of Geography
The distribution of temperature and precipitation is not uniform. For example:
Tropical regions experience high rainfall and stable warm temperatures.
Arid regions face persistent droughts due to descending dry air masses.
Polar regions show low precipitation but are highly sensitive to warming due to ice-albedo feedback.
Climate Variability
While long-term climate is stable, short-term variations such as El Niño and La Niña can temporarily alter global precipitation and temperature trends, further complicating the climate system.
El Niño: A periodic warming of the central and eastern Pacific Ocean that disrupts global weather patterns.
Industrialisation, Population, and the Great Acceleration
Industrialisation
As nations industrialised, reliance on fossil fuels became the backbone of economic growth. Industrial processes, steel production, and chemicals expanded emissions further.
Population Growth
From 2.5 billion people in 1950 to over 8 billion today, the global population surge increased:
Energy demand.
Agricultural production.
Waste generation, including landfill methane.
The Great Acceleration Indicators
Key indicators of the Great Acceleration include:
Rising CO₂ and CH₄ concentrations.
Global temperature increases.
Rapid urban expansion.
Ocean acidification due to higher CO₂ absorption.
Key Takeaways for IB ESS Students
Climate basics: Climate refers to long-term patterns of temperature and precipitation.
Anthropogenic CO₂ emissions: Began rising sharply during the Industrial Revolution and accelerated after 1950.
Major drivers: Fossil fuel use, population growth, and agricultural intensification.
Evidence: Strong correlation between rising GHG concentrations and observed temperature increases.
Conceptual link: Understanding rising emissions is critical for studying impacts, mitigation, and adaptation in subsequent subtopics.
Practice Questions
Question 2 (5 marks)
Explain how human activities since the Industrial Revolution have contributed to the rise in anthropogenic CO₂ emissions, with reference to post-1950 trends.
Mark Scheme:
1 mark for identifying the Industrial Revolution as the starting point of major increases in fossil fuel use.
1 mark for explaining how burning coal, oil, and gas for industry, energy, and transport increases atmospheric CO₂.
1 mark for reference to population growth and its role in driving higher energy and agricultural demands.
1 mark for linking post-1950 acceleration to rapid industrialisation, mechanisation, and global transport expansion.
1 mark for explicit recognition that emissions after 1950 rose far more sharply (the “Great Acceleration”) compared with pre-1950 trends.
Question 1 (2 marks)
Define the term climate and explain how it differs from weather.
Mark Scheme:
1 mark for a correct definition of climate as the long-term average of atmospheric conditions (temperature, precipitation, etc.) over at least 30 years.
1 mark for clearly contrasting it with weather as short-term atmospheric conditions.
FAQ
A 30-year period balances the need to capture long-term averages while filtering out short-term variability such as El Niño or unusual weather years.
This timeframe allows scientists to observe stable patterns of temperature and precipitation while avoiding distortion from temporary anomalies. It has also become the international standard used by the World Meteorological Organization.
Coal was the dominant fuel of the Industrial Revolution. It powered steam engines, factories, and early electricity generation, releasing significant amounts of carbon dioxide when burned.
The reliance on coal marked the beginning of widespread, large-scale human-driven emissions, setting the foundation for today’s heightened atmospheric CO₂ levels.
Population growth increased demand for:
Housing and urban infrastructure, driving cement and steel production.
Food production, leading to mechanised farming and expanded transport.
Energy for electricity and heating, mostly from fossil fuels.
The result was a steep increase in CO₂ emissions as billions more people adopted resource-intensive lifestyles.
The post-1950 era saw simultaneous, rapid increases in:
Industrial production and global trade.
Fossil fuel use, particularly oil for transport.
Agricultural intensification to feed a growing population.
Environmental indicators such as CO₂ levels, deforestation, and biodiversity loss all rose sharply, making this period unique in Earth’s human history.
Scientists use climate proxies like ice cores, sediments, and tree rings to compare past natural fluctuations with modern data.
The current pace of CO₂ increase far exceeds natural variability seen in previous millennia. Attribution studies combine observational records with computer models to separate anthropogenic influences from natural drivers such as solar cycles or volcanic activity.
