
IB Syllabus focus:
‘Ice cores, tree rings and sediments show positive correlations between atmospheric CO₂ and global temperature across glacial cycles.’
Understanding past climate is crucial for predicting future trends. Scientists use climate proxies—natural recorders like ice cores, tree rings, and sediments—to uncover long-term links between CO₂ concentrations and temperature changes.
Climate Proxies and Their Importance
Climate proxies are indirect measures of past environmental conditions. They allow scientists to reconstruct climate over hundreds of thousands of years, bridging gaps where no direct observations exist.
Climate Proxy: A preserved natural feature or material that can be analysed to infer past environmental or climatic conditions.
Proxies demonstrate the close relationship between greenhouse gases and climate patterns, supporting the theory that rising CO₂ levels contribute to global temperature increases.
Ice Cores
Formation and Information
Ice cores are cylindrical samples drilled from polar ice sheets, particularly Antarctica and Greenland.
Each annual snowfall compresses into ice layers, trapping air bubbles that preserve the atmosphere’s composition.
Data Provided
CO₂ concentrations can be directly measured from the trapped bubbles.
Isotopic composition of oxygen (δ¹⁸O/δ¹⁶O ratios) provides a temperature proxy, with higher ratios indicating warmer conditions.
Records extend back 800,000 years, covering multiple glacial–interglacial cycles.
Significance
Ice cores reveal a strong positive correlation: higher atmospheric CO₂ levels coincide with warmer global temperatures, and lower levels align with colder glacial periods.
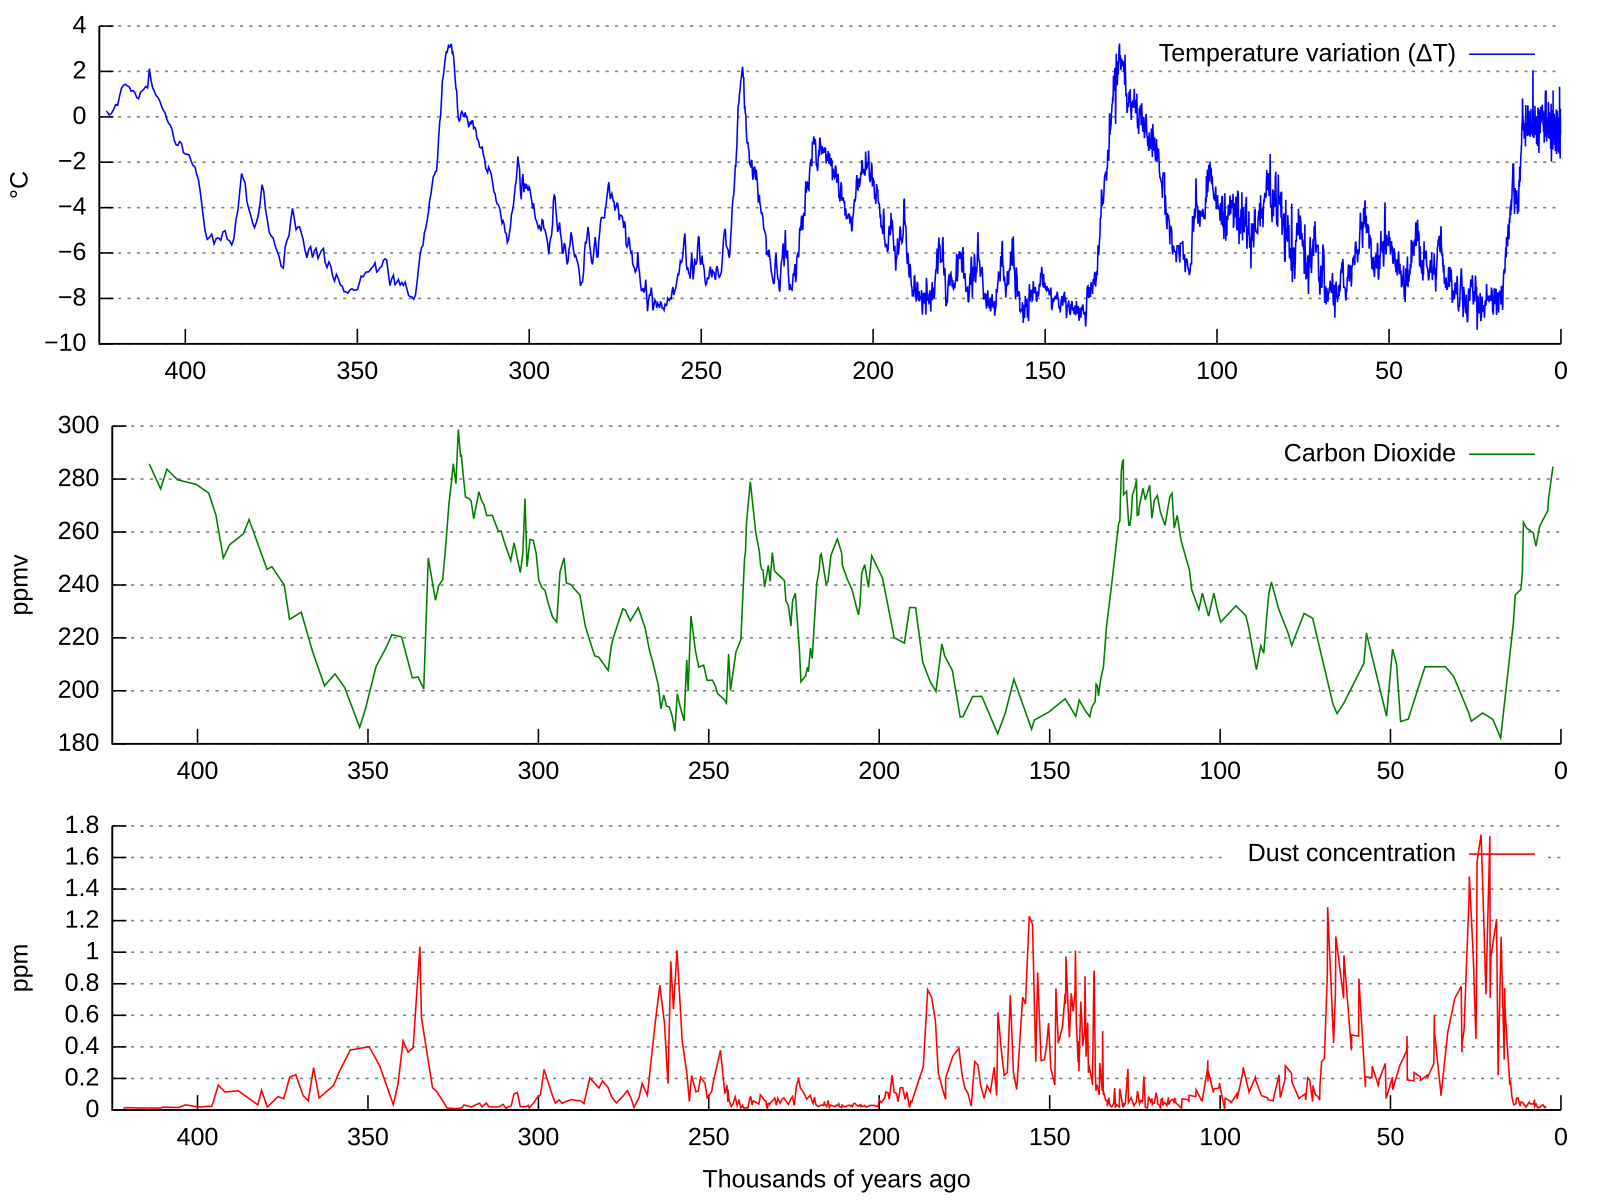
Graph showing temperature variation (ΔT), carbon dioxide concentration, and dust from the Vostok Antarctic ice core across ~420,000 years, illustrating the close alignment of CO₂ and temperature through multiple glacial–interglacial cycles. Labels and axes are clear, with stacked panels separating variables for readability. Source.
Tree Rings (Dendrochronology)
Formation and Patterns
Trees in temperate climates form annual rings, with ring width and density influenced by growing conditions.
Wide rings = favourable conditions (often warmer, wetter years).
Narrow rings = stressful conditions (colder or drier years).
Data Provided
Ring width reflects annual growth rates tied to temperature and precipitation.
Isotopic composition of carbon within rings provides additional insight into past atmospheric CO₂ concentrations.
Significance
Tree rings offer high-resolution, annual-scale climate records covering the past few thousand years, showing regional responses to global CO₂ and temperature changes.
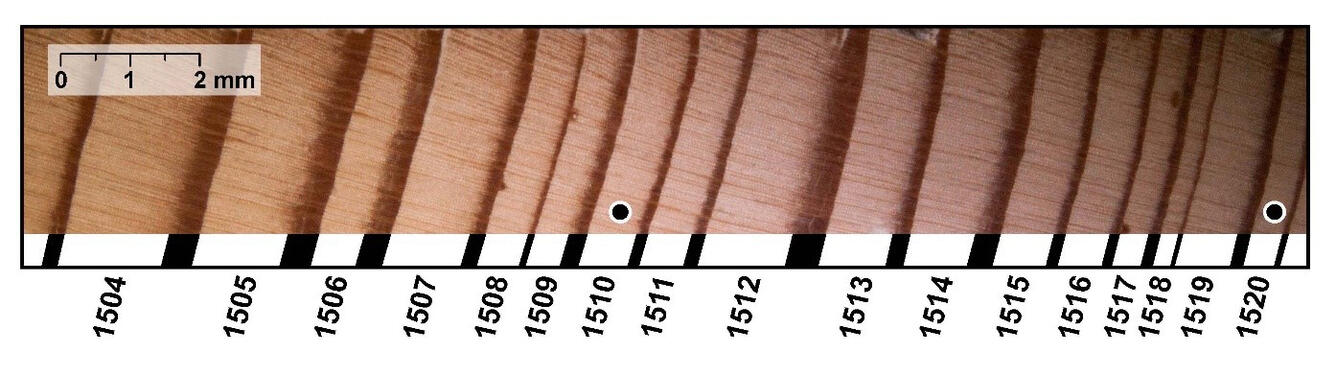
Photomicrograph and schematic of a Douglas fir core highlighting annual rings, with clear demarcation between earlywood (light) and latewood (dark) used in dendrochronology to infer past climatic conditions. The labelled components help students see what is actually measured when using tree rings as a proxy. Source.
Sediment Cores
Formation and Information
Sediments accumulate in lakes, oceans, and wetlands, preserving layers of organic and inorganic material.
Microfossils (e.g., foraminifera, diatoms) carry isotopic signatures linked to past sea surface temperatures.
Pollen grains reveal vegetation patterns influenced by climate.
Organic material composition indicates historical atmospheric CO₂ levels.
Significance
Sediment records extend back millions of years, demonstrating long-term climate–carbon relationships and broadening context beyond ice core timeframes.
Correlation Between CO₂ and Temperature
Across all proxies, data consistently show positive correlations:
During glacial periods, CO₂ concentrations were low, and global temperatures dropped.
During interglacial periods, CO₂ concentrations rose, and global temperatures increased.
This consistent pattern supports the role of greenhouse gases as primary drivers of climate change.
Positive Correlation: A relationship where an increase in one variable is associated with an increase in another variable.
The alignment between CO₂ and temperature across different proxies adds robustness to the interpretation.
Glacial–Interglacial Cycles
Key Patterns
Cycles are influenced by Milankovitch cycles (orbital variations in Earth’s position and tilt).
Proxies show that while orbital changes trigger shifts, CO₂ acts as an amplifier, reinforcing temperature trends.
CO₂ and temperature rise and fall together, with small time lags due to feedback mechanisms such as ocean absorption and release.
Evidence of Feedback
Ice-albedo feedback: warming reduces ice cover, lowering reflectivity and accelerating warming.
Ocean–atmosphere feedback: warming oceans release CO₂, which further strengthens warming trends.
Strengths and Limitations of Proxies
Strengths
Provide long-term records beyond human observations.
Multiple independent sources (ice, trees, sediments) enhance reliability.
Allow testing of climate models against past data.
Limitations
Proxies are indirect measures—interpretations require careful calibration.
Regional variations can complicate global generalisations.
Dating uncertainties may affect precise alignment of CO₂ and temperature records.
Despite limitations, the convergence of multiple proxy datasets offers robust evidence for a close link between CO₂ and global temperatures.
Importance for Modern Climate Science
Understanding past CO₂–temperature links strengthens predictions of future climate change.
Proxies provide baseline data against which modern rising emissions can be compared.
They illustrate the danger of crossing natural thresholds, as seen in past rapid warming episodes.
Key Takeaways
Ice cores, tree rings, and sediments are primary proxies for past climate.
They reveal a strong positive correlation between CO₂ and temperature over glacial–interglacial cycles.
This evidence supports the central role of greenhouse gases in driving Earth’s climate system.
Practice Questions
Question 1 (2 marks)
Identify two types of climate proxies used to demonstrate the relationship between atmospheric CO₂ and global temperature.
Mark scheme
1 mark for each correct type of proxy, up to 2 marks total.
Acceptable answers include:Ice cores
Tree rings (dendrochronology)
Sediment cores (including microfossils, pollen, or isotopic data)
Question 2 (5 marks)
Explain how ice core records demonstrate the positive correlation between atmospheric CO₂ and global temperature over glacial–interglacial cycles.
Mark scheme
1 mark for describing that ice cores trap air bubbles containing past atmospheric CO₂.
1 mark for explaining that oxygen isotopes (δ¹⁸O/δ¹⁶O ratios) in ice provide a proxy for past temperature.
1 mark for linking high CO₂ levels with warmer interglacial periods.
1 mark for linking low CO₂ levels with colder glacial periods.
1 mark for explicitly stating that the data show a positive correlation (both CO₂ and temperature rise and fall together).
FAQ
Ice cores contain trapped air bubbles that preserve the exact composition of the atmosphere, including CO₂ levels. Alongside this, the ice itself records temperature through the ratio of oxygen isotopes (δ¹⁸O/δ¹⁶O).
By analysing both the gases and isotopes from the same ice layer, scientists can directly compare atmospheric composition with past climate conditions, offering a combined record in one sample.
Each proxy type has strengths and limitations:
Ice cores cover long timescales but are geographically limited to polar regions.
Tree rings give precise annual records but only for recent millennia.
Sediment cores extend far back but can be harder to date precisely.
Using multiple proxies reduces uncertainty and provides cross-checks, ensuring that observed CO₂–temperature correlations are not artefacts of a single method.
Foraminifera are microscopic marine organisms whose shells contain oxygen isotopes. When buried in sediments, their shells preserve the isotopic signature of the seawater at the time they lived.
Analysing these isotopes provides insight into sea surface temperatures and ice volume, both of which are linked to global climate and CO₂ levels.
Tree rings form annually, allowing climate signals to be dated precisely to the year. Ring width and density capture rapid variations in growing conditions influenced by temperature and rainfall.
This high resolution makes dendrochronology valuable for studying climate fluctuations over decades to centuries, a timescale not captured by ice or sediment cores.
During glacial cycles, small orbital changes alter solar radiation patterns. This initiates warming or cooling, but feedback processes amplify the effect.
Warmer oceans release more CO₂, reinforcing warming.
Cooling oceans absorb CO₂, reinforcing cooling.
The strong correlation seen in proxies highlights how CO₂ acts as a feedback amplifier, not just a passive variable.
