HL only: first law and energy accounting
Closed system: no mass transfer, but energy can be transferred as heat and work.
Isolated system: no mass and no energy transfer.
First law of thermodynamics: .
Use the IB sign convention (Clausius): when thermal energy is supplied to the system; when work is done by the system.
Rearrangement often needed in exams: .
Work done on the system is negative; work done by the system is positive.
For a gas changing volume at constant external pressure: .
On a - graph, the area under the curve gives the work done by the gas.
If (expansion), then ; if (compression), then .
For a monatomic ideal gas: .
Therefore, for a monatomic ideal gas, internal energy depends only on temperature.
Exam trap: in a cyclic process, the system returns to its initial state, so and therefore .
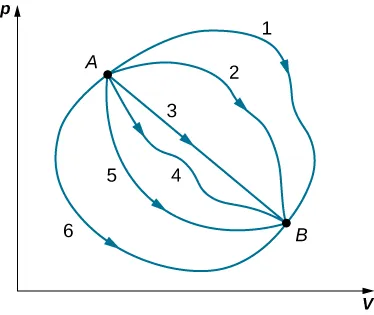
This diagram shows that different thermodynamic paths can give different values of heat and work, while the change in internal energy between the same two states is unchanged. It is useful for explaining why is a state function but and are path dependent. Source
Thermodynamic processes
Isovolumetric (isochoric): volume constant, so and .
In an isovolumetric process, the first law becomes .
Isobaric: pressure constant.
In an isobaric process, work is found from .
Isothermal: temperature constant.
For an ideal gas, in an isothermal process, so .
Adiabatic: no thermal energy transfer, so .
In an adiabatic process, .
For a monatomic ideal gas, an adiabatic process follows .
Be ready to identify processes from what is held constant and from the shape on a - diagram.
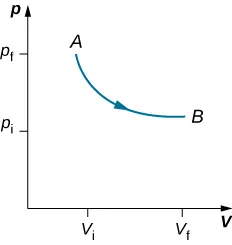
These diagrams compare isobaric, isovolumetric, isothermal, and adiabatic changes. They help you connect the graph shape to which variable stays constant and to whether heat, work, or internal energy changes most directly. Source
Entropy and microstates
Entropy measures the dispersal of energy and is often described as the degree of disorder of a system.
Greater number of possible particle arrangements means greater entropy.
Microscopic definition: , where is the number of possible microstates.
Macroscopic entropy change: .
Entropy usually increases when particles become more spread out, more random, or have more accessible states.
Typical trend: solid liquid gas in entropy.
A system can have local entropy decrease only if the surroundings gain at least as much entropy, so total entropy does not decrease overall.
Exam link: more microstates more probable macrostate higher entropy.

This image shows how the same particles can be arranged in many different microstates, and why the most likely macroscopic state is the one with the largest number of microstates. It is a strong visual for understanding . Source
Second law of thermodynamics
The second law sets constraints on which physical processes can occur.
In Clausius form: thermal energy does not flow spontaneously from a colder body to a hotter body.
In Kelvin form: no heat engine can convert all input thermal energy into useful work.
For an isolated system, entropy never decreases overall.
In a reversible process, total entropy of an isolated system stays constant.
In a real irreversible process, total entropy of an isolated system increases.
Real processes are almost always irreversible because they involve effects such as friction, unrestrained expansion, and finite temperature differences.
The second law explains the direction of spontaneous change and why perfect efficiency is impossible.
Heat engines and cyclic processes
A cyclic process returns the gas to its starting state.
Over a complete cycle, , so net heat input = net work output.
A heat engine uses a cycle to convert part of input thermal energy into useful work.
Engine efficiency: .
Since not all input energy becomes work, always .
On a - diagram, the area enclosed by a cycle equals the net work done.
Clockwise cycle on a - graph usually means net work done by the gas.
Anticlockwise cycle usually means net work done on the gas.
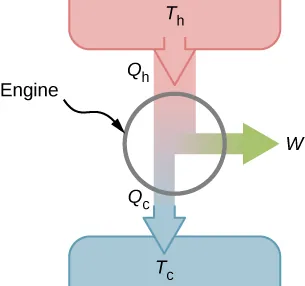
This diagram shows the essential energy flows in a heat engine: energy enters from the hot reservoir, some is converted to work, and the rest is rejected to the cold reservoir. It makes clear why engine efficiency can never be 100%. Source
Carnot cycle and maximum efficiency
The Carnot cycle is an ideal reversible cycle.
It gives the maximum possible efficiency for any engine operating between the same two reservoir temperatures.
Carnot efficiency: .
Temperatures must be in kelvin.
Higher or lower gives higher maximum possible efficiency.
No real engine can be more efficient than a Carnot engine working between the same temperatures.
The Carnot limit comes from the second law, not from engineering imperfections alone.
If an exam asks for the best possible efficiency, use the Carnot formula.
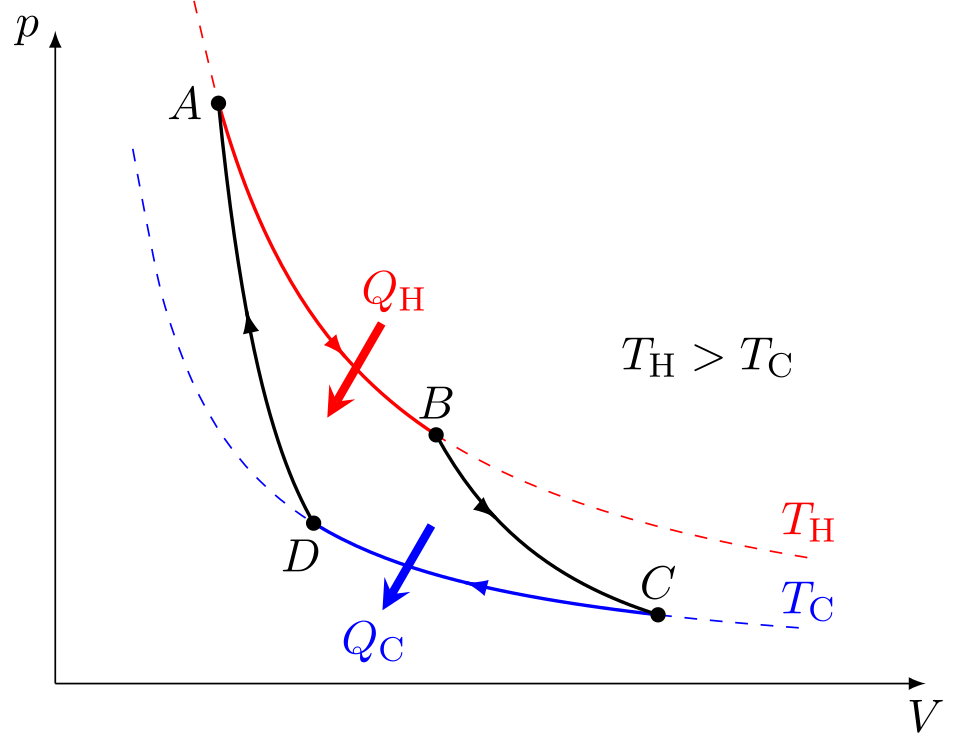
This diagram shows the Carnot cycle on a pressure-volume graph, with two isothermal and two adiabatic stages. It is useful for linking the cycle shape to net work done and to the idea of maximum theoretical efficiency. Source
Exam moves on - diagrams
Read axes carefully: pressure on vertical axis, volume on horizontal axis.
Horizontal line on a - graph means constant pressure.
Vertical line on a - graph means constant volume.
To find work, use the area under the graph or inside the loop for a cycle.
To find for a monatomic ideal gas, use temperature change only.
Then apply the first law consistently: .
Always state the sign of , , and clearly.
Checklist: can you do this?
Apply correctly using the IB sign convention.
Determine the sign of , , and for expansion, compression, and cyclic changes.
Identify and interpret isovolumetric, isobaric, isothermal, and adiabatic processes from words or - diagrams.
Use for a monatomic ideal gas and link internal energy to temperature.
Calculate and interpret engine efficiency and the Carnot limit using temperatures in kelvin.