
OCR Specification focus:
‘Process, analyse and interpret qualitative and quantitative results to reach valid conclusions where appropriate.’
Processing experimental results is essential for transforming raw observations into meaningful biological insights. Effective analysis allows patterns to be identified, trends to be described and data to be interpreted reliably, supporting logical and scientifically valid conclusions.
Processing Results
Processing results involves organising data so it can be understood and interpreted efficiently. After collecting primary observations, the information must be handled systematically to allow later comparison and evaluation. Qualitative results describe non-numerical observations, while quantitative results are numerical measurements that can be processed using appropriate mathematical or statistical techniques.
Qualitative data: Descriptive, non-numerical observations obtained during an investigation.
Once data is gathered, students must apply biological reasoning to decide how the information will be presented. Clear presentation supports interpretation by linking processed results to the experimental question.
Organising and Preparing Data
To process results effectively, students should ensure that data is:
Collated logically, for example in well-structured tables or clear written observations
Checked for completeness, ensuring no missing values
Processed consistently, using the same units and mathematical approach throughout
Linked to the variables, especially the independent and dependent variables
Quantitative results are often processed to calculate additional values that reveal trends more clearly. These may include differences, means, rates, or percentages, chosen to match the biological context of the investigation.
EQUATION
—-----------------------------------------------------------------
Mean (x̄) = Σx / n
Σx = Sum of all measured values
n = Number of measurements
—-----------------------------------------------------------------
Correct processing supports sound biological conclusions by reducing the influence of random variation and allowing comparisons between data sets.
Interpreting Results
Interpreting results is the stage at which processed information is examined to explain what it shows about the biological system being investigated. Interpretation must be analytical, logical and evidence-based. Students should:
Identify patterns, such as increases, decreases or constant relationships
Recognise trends, including positive or negative correlations
Comment on differences or similarities between groups
Relate observations to biological principles and theory
A valid interpretation must be rooted in the data rather than assumption. Students should distinguish clearly between description (what the data shows) and explanation (why it shows this, using biological understanding).
Correlation: A relationship or association between two variables.
When interpreting results, avoid implying a causal relationship unless experimental design and controls justify it. Biological data often supports correlations, but causation requires stronger evidence.
Reaching Valid Conclusions
To meet OCR expectations, students must use processed results to form valid conclusions that refer directly to the original experimental question. A strong conclusion:
Addresses the aim of the investigation
Uses evidence from the processed results
Refers to trends or patterns in qualitative and quantitative data
Applies biological knowledge to justify the reasoning
A valid conclusion remains cautious and does not overstate certainty. It should acknowledge where the data supports an idea and avoid claiming proof beyond the strength of the results.
Ensuring Reliability in Processing and Interpretation
Reliable interpretation depends on how well results have been processed. Students should consider:
Consistency of repeated measurements
Appropriate choice of mathematical techniques
Use of clear biological terminology
Accuracy in units, scales and data handling
Incorrect processing, such as mixing units or miscalculating averages, can undermine analysis and lead to incorrect conclusions. Clarity and precision are therefore essential.
Presenting Processed Results for Interpretation
Processed results must be presented clearly so they can be interpreted without ambiguity. Effective presentation techniques include:
Bullet-pointed qualitative observations
Ordered tables for numerical data
Graphs with labelled axes, scales, units and titles
Correctly plotted points and suitable line or curve choices
Trend descriptions written alongside visual data
Graphs are particularly valuable for revealing correlations or trends in quantitative data.
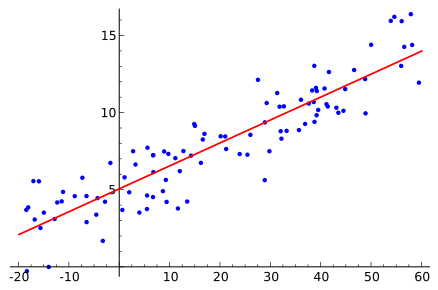
Scatter plot with a fitted linear regression line showing a positive correlation between two variables. The data points represent measurements, and the best-fit line highlights the overall pattern used for interpreting quantitative trends. Source.
Processed results must be presented clearly so they can be interpreted without ambiguity. Effective presentation techniques include: (bullet-pointed list continues...)
Linking Results to Biological Context
Interpretation must connect processed findings to wider biological understanding. By linking observations to enzyme theory, membrane behaviour, ecological relationships or genetic patterns, students demonstrate higher-level analytical skill. This contextual link is essential for reaching valid scientific conclusions and meets OCR expectations for meaningful interpretation.
When interpreting quantitative relationships, comment on direction (positive/negative), strength (weak/moderate/strong), and form (linear or non-linear), noting any outliers.
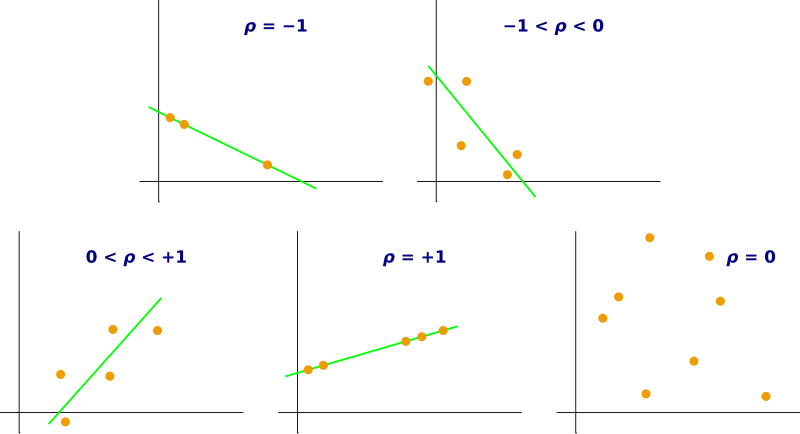
A set of scatter plots illustrating varying directions and strengths of correlation. Each diagram helps interpret how closely data points follow a trend, reinforcing accurate description of positive, negative, weak and strong relationships. Source.
Final Considerations in Interpretation
When processing and interpreting results, students should remain objective. Data must be interpreted as it is, not as expected. Unexpected trends can still be valid if supported by evidence. Clear, logical analysis rooted in processed results ensures conclusions are scientifically credible and aligned with the specification.
Practice Questions
Question 1 (2 marks)
A student investigates how light intensity affects the rate of photosynthesis and collects quantitative results. Explain what is meant by a correlation when interpreting the processed data.
Question 1 (2 marks)
Award 1 mark for each of the following points, up to a maximum of 2:
A correlation is a relationship or association between two variables. (1)
As one variable changes, the other also changes in a recognisable pattern (positive or negative). (1)
Question 2 (5 marks)
A student processes results from an enzyme experiment and plots a graph showing how temperature affects the rate of reaction. The data show a steady increase in rate up to 40 degrees Celsius, followed by a rapid decrease. Discuss how the student should interpret these results to reach a valid conclusion. In your answer, refer to patterns in the data, trends on the graph, and relevant biological knowledge.
Question 2 (5 marks)
Award marks for the following valid points, up to a maximum of 5:
Identification of pattern in results: rate increases as temperature increases up to a point (1)
Correct identification of peak trend: maximum rate at around 40 degrees Celsius (1)
Description of rapid decrease after 40 degrees Celsius (1)
Linking to biological knowledge: increased kinetic energy increases collisions and enzyme–substrate formation up to the optimum (1)
Linking to biological knowledge: drop in rate explained by denaturation of the enzyme at higher temperatures (1)
FAQ
Processed data highlights overarching patterns by reducing the impact of individual fluctuations. Calculating measures such as the mean or rate enables clearer visual interpretation, especially when plotted on a graph.
A genuine trend will remain visible across the dataset, even after processing, whereas random variation appears inconsistent and does not follow a predictable direction.
Over-interpretation occurs when conclusions go beyond what the data actually shows. This is particularly risky with small datasets or weak correlations.
To avoid this, conclusions should:
Refer directly to evidence
Avoid claiming causation unless fully supported by the method
Recognise limitations in the results
Qualitative observations add contextual information that may help explain patterns in numerical data. For example, noting colour changes, precipitates, or behavioural differences can support a biological explanation of a trend.
When combined, qualitative and quantitative evidence provide a fuller understanding, allowing interpretations to link more effectively to biological principles.
Consistency ensures that repeated measurements are treated in the same way, which improves reliability. If each repeat is processed differently, the final interpretation becomes skewed.
Using identical units, calculation methods, and treatment of anomalies ensures fair comparison, making patterns easier to recognise and justify.
Direction shows whether variables increase together or move in opposite ways, while strength indicates how closely their relationship follows a pattern.
Discussing both helps determine how convincing the trend is. A weak correlation may suggest other influencing factors, whereas a strong correlation gives clearer support for the interpretation.
