
OCR Specification focus:
‘Make and record observations and measurements, and keep appropriate records of experimental activities.’
Accurate observation, measurement, and record-keeping are essential in biological investigations, ensuring data reliability, reproducibility, and scientific integrity. Precision, clarity, and adherence to systematic methods underpin every valid experiment.
Observations in Practical Biology
Observations are the foundation of experimental science, forming the link between theoretical predictions and empirical evidence. Observations may be qualitative (descriptive) or quantitative (numerical).
Types of Observations
Qualitative observations describe features such as color changes, texture, or shape, for example, noting a color shift in an enzyme-catalyzed reaction.
Quantitative observations involve measurable quantities, such as temperature, mass, or pH, often collected using instruments to ensure objectivity.
Observation: The process of systematically noticing and recording events or changes during an experiment, using sensory or instrumental methods.
Observations must be objective, meaning they should be free from personal bias or interpretation. Consistency in method ensures that results can be compared across repetitions and between investigators.
Recording Observations
Observations should be recorded immediately, ideally in a laboratory notebook or digital equivalent, ensuring the data’s authenticity.
Records should be:
Dated and signed to confirm authenticity.
Written in ink, not pencil, to prevent alteration.
Organized chronologically, clearly linking experimental steps with outcomes.
Free from correction fluid; errors should be crossed out with a single line and initialed.
Measurements in Experimental Work
Measurements translate biological phenomena into quantifiable data. They must be accurate, precise, and reproducible to provide meaningful results.
Accuracy and Precision
Accuracy refers to how close a measurement is to the true value.
Precision describes how closely repeated measurements agree with each other.
Error: The difference between a measured value and the true value, arising from limitations in equipment or human perception.
Measurement Tools and Units
Students must use instruments such as balances, pipettes, burettes, thermometers, and colorimeters correctly, selecting the most appropriate tool for the measurement required.
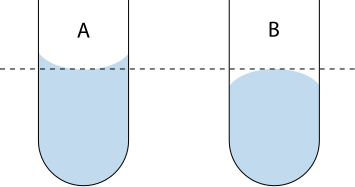
A labeled diagram showing how to read the bottom of the meniscus at eye level to avoid systematic misreads. It contrasts correct and incorrect sightlines, clarifying why readings above or below eye level bias volume. This supports precise use of volumetric glassware. Source.
Measurements must always include:
A numerical value and a unit (e.g., cm, g, °C).
Appropriate significant figures, matching the instrument’s precision.
Uncertainty estimates, showing the degree of confidence in the result (e.g. ±0.1 cm).
EQUATION
—-----------------------------------------------------------------
Percentage Error (%) = (Uncertainty ÷ Measured Value) × 100
Uncertainty = Estimated range of possible error in measurement (same units as measured value)
Measured Value = Observed reading or result obtained from an instrument
—-----------------------------------------------------------------
Reducing Measurement Error
To minimize uncertainty and error:
Calibrate instruments before use.
Repeat measurements and calculate a mean value.
Maintain consistent experimental conditions.
Avoid parallax error by aligning the eye with the measurement scale.
An uncluttered schematic of parallax, showing how a pointer appears to shift relative to a scale when the eye is not perpendicular. This highlights why consistent eye position is essential to reduce systematic error. The visual focuses only on the principle needed for routine lab measurements. Source.
Recording and Managing Scientific Data
Scientific record-keeping ensures that data remain traceable, understandable, and verifiable. A clear record is a legal and ethical requirement in scientific research.
Structure of Experimental Records
Effective records should include:
Title: Clear identification of the experiment.
Objective: Statement of the hypothesis or aim.
Materials and Methods: Detailed enough for replication.
Results: All raw data, clearly organized.
Analysis and Discussion: Interpretation of data trends.
Recording Quantitative Data
Raw data should be entered in a data table, including:
Independent variable (controlled by the experimenter).
Dependent variable (measured during the experiment).
Units for each variable are clearly shown in column headings.
Repeated readings to calculate averages and identify anomalies.
Good Practice in Data Handling
Record data immediately upon collection.
Avoid rounding until final calculations.
Maintain the same decimal place consistency across a dataset.
Distinguish between raw data (original observations) and processed data (calculations such as means or rates).
Graphical and Numerical Representation of Data
While this subsubtopic focuses on recording, not presentation, students must understand how data organization supports valid representation in later analysis.
Converting Observations into Data
Qualitative observations may be transformed into quantitative data using rating scales or numerical codes, for example, scoring growth on a scale of 1–5. This allows comparison and statistical treatment.
Data Integrity and Traceability
Every data point should be traceable back to its source. This means:
Label all data sheets, diagrams, and graphs clearly.
Linking raw data with experimental conditions.
Ensuring that all files, whether digital or paper-based, follow a consistent naming and storage protocol.
Maintaining Scientific Integrity in Record-Keeping
Integrity underpins all scientific documentation. Students must never fabricate, alter, or selectively report data.
Ethical Considerations
Record all results, including anomalies.
Use unambiguous terminology and SI units.
Ensure data security and confidentiality when working with sensitive materials or digital records.
Scientific Integrity: Adherence to ethical and professional standards in collecting, recording, analyzing, and reporting scientific data.
Auditing and Verification
Records must be auditable, allowing an independent person to repeat the investigation based on the notes provided. This includes maintaining original copies and backing up digital records securely.
The Role of Digital Tools
Modern biology often employs software for data logging, sensor-based measurement, and database management. Even when using technology, students remain responsible for verifying accuracy and ensuring appropriate metadata accompany each dataset (e.g., time, date, conditions).
Linking Observations, Measurements, and Records
Observation, measurement, and record-keeping are interconnected. An accurate observation loses value without a reliable measurement, and both are meaningless without proper documentation. Together, they ensure scientific reproducibility, transparency, and credibility, aligning with the OCR specification requirement to “make and record observations and measurements, and keep appropriate records of experimental activities.”
Practice Questions
Question 1 (2 marks)
Explain the difference between accuracy and precision in the context of biological measurements.
Mark scheme:
1 mark for defining accuracy: how close a measurement is to the true or accepted value.
1 mark for defining precision: how close repeated measurements are to each other, regardless of whether they are close to the true value.
Question 2 (5 marks)
Describe how a student should make and record observations and measurements during a biological investigation to ensure that the results are reliable and reproducible. Include details about good record-keeping practice.
Mark scheme:
Award up to 5 marks for the following valid points (1 mark each, any five):
Record observations immediately in a laboratory notebook or digital log to prevent loss or alteration of data.
Use appropriate equipment (e.g., pipettes, balances, thermometers) correctly and record units and uncertainty with each measurement.
Ensure accuracy and precision through repeated readings and consistent technique.
Maintain clear, dated, and permanent records written in ink, avoiding correction fluid; cross out errors with a single line and initial.
Distinguish raw data from processed data (e.g., means, rates) and organize results in properly labeled tables.
Keep all data traceable and auditable, allowing others to verify or repeat the investigation.
(Maximum 5 marks; award full credit for equivalent correct points phrased differently.)
FAQ
Use the mean when data are normally distributed and outliers are not extreme.
Use the median when there are significant outliers or skewed data, as it better represents central tendency in such cases.
The mode is rarely used in biological measurements unless working with categorical or discrete data (e.g. most common number of petals on a flower).
Choosing the appropriate average improves the accuracy of conclusions drawn from results
Environmental variables such as temperature, light intensity, and humidity can significantly affect biological processes.
Recording these alongside measurements ensures that:
Results are more contextualised and interpretable
The experiment can be more easily repeated under identical conditions
Unexpected results can sometimes be explained by environmental factors
Neglecting to record them may lead to poor reproducibility and unclear conclusions.
A properly calibrated instrument should:
Give expected readings when tested against known standards (e.g. distilled water with a pH of 7)
Match readings from another verified instrument when measuring the same sample
Show zero or a consistent baseline reading when expected (e.g. balance reads 0.00g with empty container)
Calibration should be confirmed before each use, particularly in assessed practical work.
Raw data includes all primary measurements taken during the experiment—times, volumes, masses, temperatures—recorded exactly as observed.
Processed data involves calculations based on raw data, such as:
Means of repeated values
Rates (e.g. rate of reaction)
Percentage change or differences
Both types should be clearly distinguished and kept in the lab record for full transparency and assessment.
Repeatability refers to how consistent results are when the same person uses the same equipment under the same conditions.
Reproducibility, on the other hand, measures how consistent results are when different people, labs, or equipment are used.
Understanding both helps identify whether a measurement issue is due to technique or inherent variability in the method or conditions. Both are important in evaluating reliability.
