
OCR Specification focus:
‘Represent cells with accurate drawings and use the magnification formula confidently.’
Accurate biological drawings and correct magnification calculations are essential microscopy skills, allowing biologists to represent specimens faithfully and interpret measured structures with confidence in scientific contexts.
Principles of Biological Drawings
OCR requires students to produce accurate and clear biological drawings to represent what is observed using a microscope. A biological drawing is not a sketch; it must be a precise and unshaded line representation showing visible structures only. Students must avoid artistic embellishment and focus on proportional accuracy.
Core rules for biological drawings
Biological drawings must follow strict conventions to ensure clarity:
Use clear, continuous lines with a sharp pencil
Do not shade or add artistic effects
Proportion must reflect what is seen down the microscope
Include only observable structures
Large diagrams that occupy most of the space provided
Smooth, confident lines, not feathered or sketchy marks
Labelling and annotation
Labels must be:
Written in clear, horizontal print
Connected by straight label lines that do not cross
Positioned so the diagram remains uncluttered
Annotations should briefly describe visible structures or relevant functions. Labels identify; annotations explain.
Scale and proportion
Maintaining correct proportional relationships is essential. Even without precise measurement, the relative size of cell structures must be correct. Students should compare widths, lengths, and distances before committing lines to paper for accuracy.
Magnification in Biological Drawings
OCR requires confident use of the magnification formula to calculate or check specimen size. Magnification indicates how many times larger an image is than the real object, allowing biological drawings and microscope images to be interpreted numerically.
EQUATION
—-----------------------------------------------------------------
Magnification (M) = Image Size (I) ÷ Actual Size (A)
M = Magnification (no unit)
I = Image size (mm or μm)
A = Actual size (mm or μm)
—-----------------------------------------------------------------
When using this formula, units must be consistent. Students should convert mm to μm or vice versa before calculating. Once magnification is known, proportions in drawings can be checked against expectations.
When interpreting micrographs, use any scale bar provided rather than printed magnification, then apply the magnification formula.
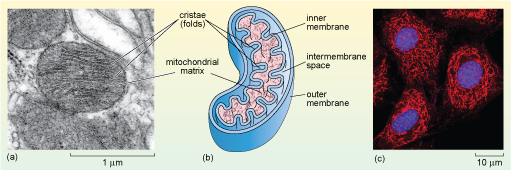
Transmission electron micrograph of mitochondria. This type of image allows students to calculate actual sizes using the scale bar and the magnification formula. Additional organelle features are shown for context but are not required beyond supporting measurement skills. Source.
After applying the magnification formula, students can assess whether their drawing reflects realistic sizes. This prevents common errors such as oversized nuclei or incorrect organelle spacing.
Using an Eyepiece Graticule for Measured Drawings
Although calibration is covered elsewhere, OCR expects drawings to align with measured observations. An eyepiece graticule, placed in the microscope eyepiece, contains a scale used to measure structures seen under the microscope.
Eyepiece graticule: A measuring scale fitted inside the eyepiece, used to estimate specimen size when calibrated.
The graticule must be calibrated using a stage micrometer so its arbitrary units translate into real units. Once calibrated, biological drawings can be scaled accurately.
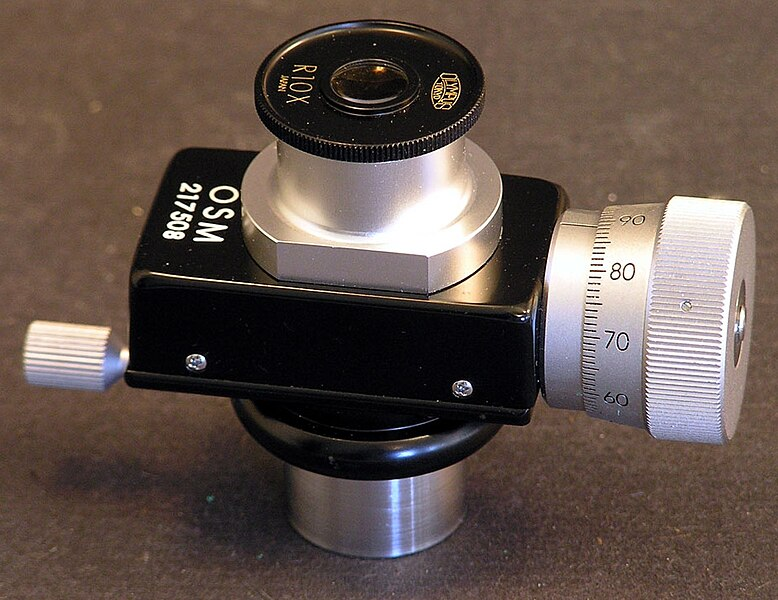
A measuring eyepiece containing a graticule for microscopic measurement after calibration. This gives students a visual reference for the tool used to generate real size data from microscope observations. Extra instrument information is incidental and not required by the syllabus. Source.
Students should record measured values carefully, especially when preparing annotated diagrams for microscopy tasks.
Incorporating Scale Bars
A scale bar is a visual indicator of real size added to drawings. It provides a reference for readers who need to understand dimensions without recalculating magnification.
Scale bar: A labelled line on a diagram indicating a known distance in real units to show scale.
Scale bars must be drawn to scale, labelled clearly, and be proportional to the structure illustrated.
Accuracy, Precision and Good Scientific Practice
To meet OCR expectations, students must present drawings as scientific records rather than artistic impressions. Drawings should be neat, labelled, and mathematically meaningful through magnification and scale.
Good practice includes:
Checking proportional accuracy before finalising lines
Recording magnification alongside diagrams
Using consistent line thickness
Avoiding shading, colouring, or unrealistic detail
Scale information, magnification, and labels must always accompany diagrams when relevant to microscopy observations.
Interpreting and Calculating Size from Microscope Images
Magnification enables students to determine the real size of structures in photomicrographs by rearranging the magnification formula. This skill is essential in microscopy questions and supports accurate biological representation. Clear attention to units, image measurement, and proportional reasoning ensures valid results that align with OCR requirements.
Consistent application of these rules allows students to produce drawings that meet scientific standards and fulfil OCR assessment criteria for accuracy, clarity, and correct magnification use.
Practice Questions
Question 1 (2 marks)
A student produces a biological drawing of a plant cell observed under a light microscope. Give two features that must be included for the drawing to meet accepted biological drawing conventions.
Question 1 (2 marks)
Award 1 mark for each valid point:
Clear, continuous lines with no shading (1)
Labels written horizontally with straight, ruled label lines that do not cross the diagram (1)
Accept alternative correct points, such as:Correct proportions (1)
Large, clear diagram taking up available space (1)
Question 2 (5 marks)
Figure 1 shows a photomicrograph of a eukaryotic cell. The image length of the cell measures 85 mm. The actual cell length is 85 micrometres.
(a) Calculate the magnification of the image. Show the formula you use. (2 marks)
(b) Explain how the student could ensure their biological drawing of this cell is considered accurate and scientifically valid. (3 marks)
Question 2 (5 marks)
(a) Magnification calculation (2 marks)
Correct formula: magnification = image size divided by actual size (1)
Correct value: 85 mm divided by 85 micrometres = x1000 (1)
(Units must be converted or correctly implied for full credit.)
(b) Biological drawing accuracy (3 marks)
Award up to 3 marks for any of the following:
Drawn with clear, continuous lines and no shading (1)
Correct proportions based on the observed image (1)
Labels written clearly with straight lines that do not cross, and only observable structures included (1)
Magnification or scale bar stated alongside the drawing (1)
(Maximum 3 marks in part b)
FAQ
To calculate a scale bar, decide the real distance you want it to represent, such as 10 micrometres. Measure a proportional distance on the image using the magnification value.
For example, if the magnification is x400, a 10 micrometre structure would appear as 4000 micrometres (4 mm) in the image. Draw the scale bar to this measured length and label it clearly with the real distance, not the enlarged one.
Straight label lines avoid confusion, make the diagram easy to read, and help examiners follow annotations quickly.
Crossing lines or diagonal labels reduces clarity, especially in complex diagrams with many features.
This rule is standard in scientific illustration because clarity and accuracy are prioritised over artistic style.
Common proportional mistakes include:
Nuclei drawn too large compared with the cytoplasm
Organelles spaced unrealistically or drawn in incorrect numbers
Cells drawn with uneven widths or distorted shapes
Checking measurements from the microscope image before drawing reduces these errors.
Shading implies depth and artistic interpretation, which can misrepresent what is actually visible.
Scientific drawings must record observations, not visual effects, so features are depicted with single, clean lines.
If a feature needs emphasis, it should be done through labelling or annotation, not tonal shading.
A scale bar is preferred when diagrams or images may be resized during printing or digital display.
Because magnification changes when an image is enlarged or reduced, the scale bar remains a fixed reference for real size.
For hand-drawn diagrams in exams, either is acceptable, but scale bars are more reliable in reproduced images.
