
OCR Specification focus:
‘Construct genetic diagrams for monogenic and dihybrid crosses, multiple alleles, codominance and sex linkage to predict offspring genotypes and phenotypes.’
Understanding inheritance through genetic diagrams allows prediction of offspring genotypes and phenotypes. This topic explores how genes interact in monogenic, dihybrid, multiple allele, codominant, and sex-linked crosses.
Monogenic Inheritance
Monogenic inheritance involves a single gene with two alleles determining a characteristic. The alleles may be dominant or recessive.
Allele: An alternative version of a gene found at the same locus on homologous chromosomes.
Homozygous and Heterozygous Genotypes
Homozygous individuals have two identical alleles (e.g., AA or aa).
Heterozygous individuals have two different alleles (e.g., Aa).
The dominant allele masks the effect of a recessive allele in heterozygotes.
Phenotype: The observable characteristics of an organism, determined by genotype and environmental influence.
Genetic Diagrams for Monogenic Crosses
Genetic diagrams (Punnett squares) show parental alleles, gametes, and potential offspring combinations.
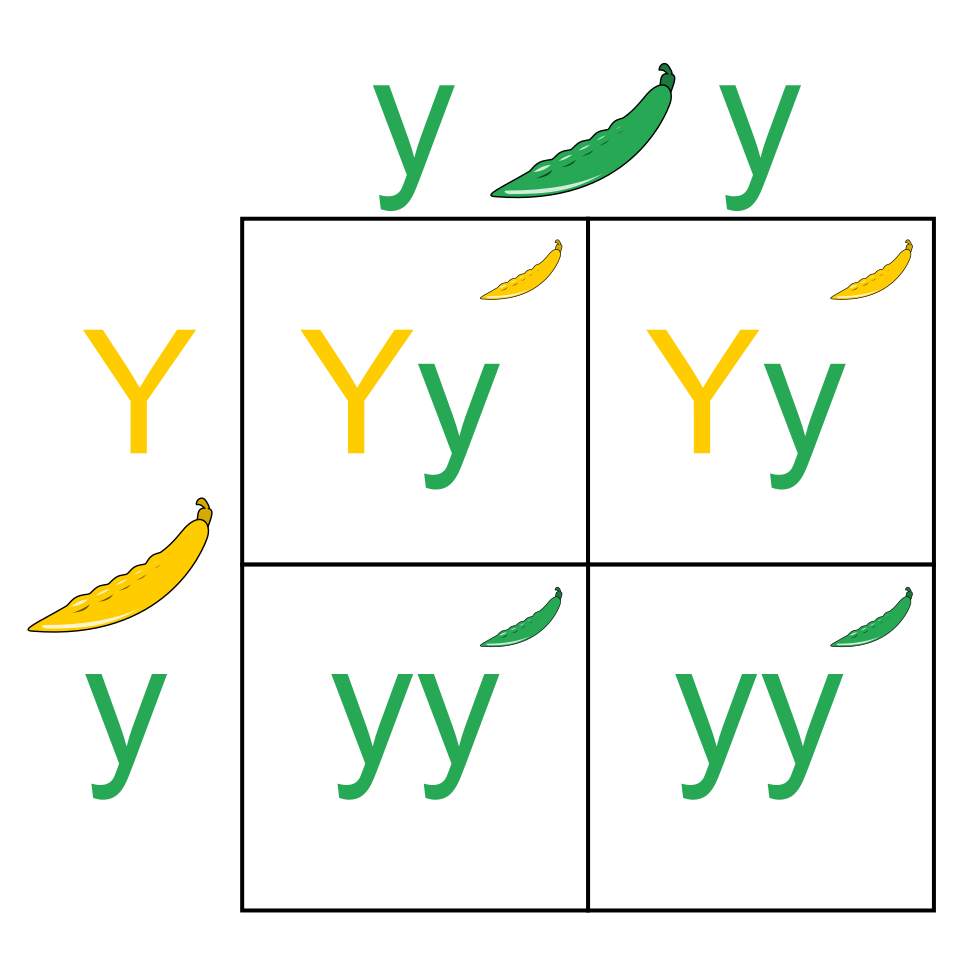
A labelled Punnett square for a monohybrid cross showing how parental alleles combine in offspring. The grid displays four possible genotype combinations and the resulting dominant/recessive phenotypes. Source.
Steps:
Identify parent genotypes.
Determine gametes.
Cross gametes in a Punnett square.
Deduce genotypic and phenotypic ratios.
Typical monohybrid cross outcome:
Genotypic ratio: 1 homozygous dominant : 2 heterozygous : 1 homozygous recessive
Phenotypic ratio: 3 dominant : 1 recessive (for complete dominance)
Dihybrid Inheritance
Dihybrid crosses investigate two genes, each with two alleles, inherited simultaneously.
This illustrates independent assortment, where alleles of different genes separate independently during gamete formation (Mendel’s Second Law).
Setting Up a Dihybrid Cross
Each parent produces four gamete combinations (e.g., AB, Ab, aB, ab).
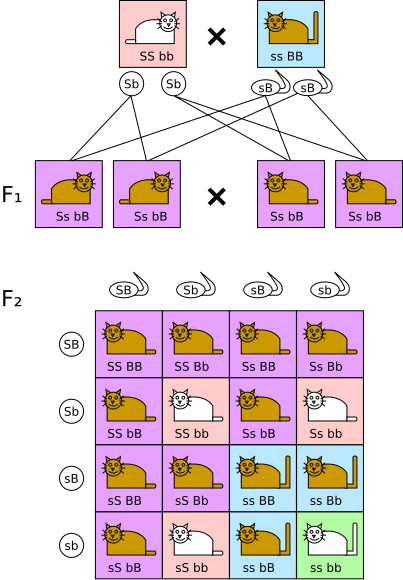
A dihybrid Punnett square (4×4) showing gametes for two unlinked genes and all 16 offspring genotype combinations. The layout demonstrates independent assortment and the derivation of the 9:3:3:1 phenotypic ratio. Source.
When crossed, these combinations yield 16 genotype possibilities.
Typical dihybrid ratio (for unlinked genes):
Phenotypic ratio: 9 dominant for both traits : 3 dominant for one : 3 dominant for the other : 1 recessive for both.
Linkage Considerations
If genes are on the same chromosome, they are linked and do not assort independently. Crossing over during meiosis may break linkage, creating recombinant offspring.
Multiple Alleles
Some genes have more than two allelic forms in the population, though individuals still carry only two alleles.
Multiple Alleles: A situation where a gene has three or more allelic variants within the population gene pool.
Example Structure
An allele hierarchy may exist:
Dominant allele (A1) expressed over A2,
A2 expressed over A3, and so forth.
This creates complex inheritance patterns where dominance relationships determine phenotype combinations.
Codominance
In codominance, both alleles in a heterozygote contribute equally and independently to the phenotype.
Codominance: The condition where both alleles in a heterozygote are expressed fully, producing a combined phenotype.
Characteristics
No allele is recessive; both are active.
Phenotypes often show mixed or intermediate characteristics.
Represented using different uppercase letters (e.g., Cᴿ and Cᵂ).
Codominance in Genetic Diagrams
Codominant crosses produce three possible phenotypes:
Homozygous for one allele (phenotype 1)
Homozygous for the other allele (phenotype 2)
Heterozygous (combined phenotype)
Example Pattern
In plants such as carnations:
CᴿCᴿ = red flowers
CᵂCᵂ = white flowers
CᴿCᵂ = pink flowers (codominant blend)
Sex Linkage
Certain genes are located on the sex chromosomes (X or Y), resulting in sex-linked inheritance patterns.
In humans, the X chromosome is larger and carries many genes; the Y chromosome carries fewer.
Sex Linkage: Inheritance of genes located on the sex chromosomes, where expression differs between males (XY) and females (XX).
X-Linked Inheritance
Females (XX): two alleles per gene locus; can be homozygous or heterozygous.
Males (XY): one X and one Y chromosome; the single X-linked allele is always expressed.
Therefore, males are hemizygous for X-linked genes.
Key Features
Recessive X-linked disorders (e.g., colour blindness, haemophilia) are more common in males, as no corresponding allele on Y can mask the defective X.
Females can be carriers if heterozygous.
Genetic Diagrams for Sex Linkage
To construct:
Represent X and Y chromosomes explicitly (e.g., XᴴXʰ, XʰY).
Cross male and female gametes to predict genotypic and phenotypic outcomes.
Record inheritance ratios separately for male and female offspring.
Typical outcomes show:
Carrier mothers (XᴴXʰ) can produce both normal and affected sons.
Daughters may be carriers or unaffected, depending on the paternal X.
Y-Linked Inheritance
Genes on the Y chromosome are passed exclusively from father to son.
These traits are rare and restricted to male-specific characteristics.
Predicting Genotypes and Phenotypes
In all genetic diagrams:
Genotype determines the phenotype through gene expression.
Ratios are based on probabilities derived from meiosis and random fertilisation.
Environmental factors may modify expression but not inheritance pattern.
EQUATION
—-----------------------------------------------------------------
Phenotypic Ratio (PR) = Number of each phenotype observed ÷ Total number of offspring
PR = Expression of probability of inheriting specific traits
—-----------------------------------------------------------------
Using this principle, inheritance predictions can be compared with experimental or observed outcomes to identify deviations, often explained by linkage, mutation, or epistasis.
Application in Biological Studies
Genetic diagrams underpin breeding experiments, pedigree analysis, and research into genetic diseases.
They also form the foundation for studying evolutionary inheritance patterns and population genetics.
Practice Questions
Question 1 (2 marks)
Explain why males are more likely than females to express recessive X-linked genetic disorders.
Mark Scheme:
1 mark for recognising that males have only one X chromosome (are hemizygous).
1 mark for explaining that any recessive allele on the X chromosome will be expressed because there is no corresponding allele on the Y chromosome to mask its effect.
Question 2 (5 marks)
A plant species has a gene for flower colour with two alleles: R (red) and r (white). Another gene on a different chromosome determines leaf shape, with alleles L (lobed) and l (smooth).
A heterozygous plant for both traits (RrLl) is self-fertilised.
(a) State the number of different gamete combinations that this plant can produce. (1 mark)
(b) Draw or describe the expected phenotypic ratio of the offspring. (3 marks)
(c) Explain why the actual phenotypic ratio observed may differ from the expected ratio. (1 mark)
Mark Scheme:
(a)
1 mark: Four gamete combinations (RL, Rl, rL, rl).
(b)
1 mark: Correctly identifies expected ratio as 9:3:3:1.
1 mark: Identifies phenotypes corresponding to the ratio (9 red lobed : 3 red smooth : 3 white lobed : 1 white smooth).
1 mark: Correct logic shown in describing independent assortment of alleles for two genes.
(c)
1 mark: States that actual ratios may differ due to random fertilisation, small sample size, or linked genes reducing independent assortment.
FAQ
A genotypic ratio shows the proportion of each possible genetic combination (e.g. AA, Aa, aa) among the offspring.
A phenotypic ratio, however, shows the proportion of visible traits or characteristics resulting from those genotypes. For example, a 1:2:1 genotypic ratio may correspond to a 3:1 phenotypic ratio if one allele is dominant.
In cases of codominance or incomplete dominance, the genotypic and phenotypic ratios are often the same because heterozygotes have distinct phenotypes.
Crossing over occurs during prophase I of meiosis when homologous chromosomes exchange segments.
This process can separate alleles that were originally linked on the same chromosome, creating recombinant gametes.
As a result:
Expected ratios (like 9:3:3:1) may not hold.
Offspring display new combinations of traits not seen in either parent.
The greater the distance between two genes on a chromosome, the more likely crossing over will occur between them.
Multiple alleles increase genetic diversity within a species, providing a broader range of possible phenotypes.
This allows populations to adapt more effectively to environmental changes. For example, the human ABO blood group system involves three alleles (IA, IB, and i), producing four phenotypes.
Such systems:
Maintain variation through multiple combinations of dominant and codominant alleles.
Help demonstrate complex inheritance patterns not visible in simple monogenic traits.
Yes. Codominance can exist within polygenic traits, where each contributing gene may have codominant alleles.
For instance:
Each gene in a polygenic system can show codominance between its alleles.
The overall phenotype results from the additive effects of several codominant gene pairs.
However, polygenic inheritance typically produces continuous variation (e.g., human skin colour), while simple codominance in one gene leads to discrete variation (distinct categories).
The Y chromosome is much smaller than the X chromosome and carries fewer genes — mostly those involved in male sex determination and spermatogenesis.
Because of this limited gene content:
Very few traits are Y-linked.
Most sex-linked traits are X-linked, as the X chromosome contains hundreds of functional genes unrelated to sex determination.
Y-linked inheritance is always father to son, showing a direct, unbroken male line.
