
OCR Specification focus:
‘Apply the chi-squared statistical test to compare observed and expected ratios and assess the significance of deviations in inheritance data.’
The chi-squared test in genetics evaluates whether observed inheritance data matches expected Mendelian ratios, allowing scientists to assess if differences are due to chance or another biological factor.
The Purpose of the Chi-Squared Test in Genetics
The chi-squared (χ²) test is a statistical method used to compare observed results (actual experimental data) with expected results (predicted genetic ratios). In genetics, it determines whether deviations between these values are small enough to occur by chance or large enough to suggest that another factor, such as linkage or epistasis, is influencing inheritance.
When breeding organisms, such as pea plants in Mendelian studies, expected ratios (e.g., 3:1 for monohybrid crosses) are based on theoretical probabilities. However, due to random assortment and sample variation, real data rarely match predictions exactly. The chi-squared test quantifies whether such variation is statistically significant.
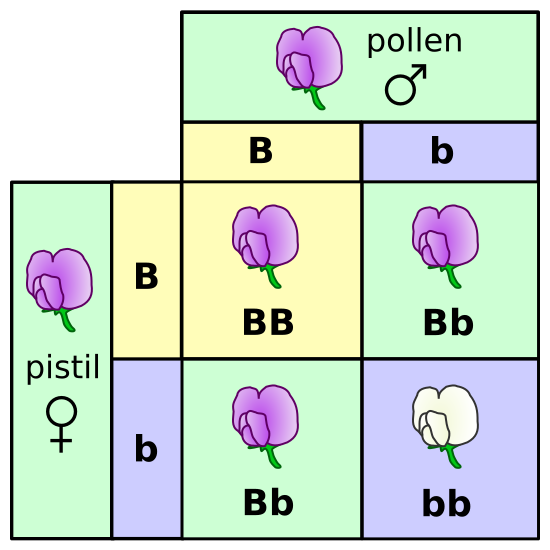
Punnett square for a monohybrid cross producing a 3:1 phenotypic ratio, the foundation for computing expected frequencies (E) in a chi-squared test. Labels show the parental gametes and the resulting F₂ genotype combinations that yield the 3:1 phenotype ratio. This figure includes only essential Mendelian detail and no extra content. Source.
Statistical Hypothesis in the Chi-Squared Test
Before applying the test, a null hypothesis (H₀) is proposed:
“The difference between observed and expected frequencies is due to chance alone.”
If this hypothesis is rejected, it suggests a biological explanation, such as gene interaction, linkage, or mutation, may be influencing the results.
A significance level, typically p = 0.05, is chosen to determine the threshold for rejecting H₀. This means there is a 5% probability that any observed difference is due to random chance.
Key Terms and Definitions
Observed Value (O): The actual number of individuals or outcomes recorded in an experiment.
After defining the observed value, it is necessary to compare it with what is predicted theoretically.
Expected Value (E): The number of individuals predicted for each phenotype or category according to the genetic ratio.
The comparison of observed and expected data provides the foundation for calculating chi-squared.
The Chi-Squared Formula
EQUATION
—-----------------------------------------------------------------
Chi-Squared (χ²) = Σ((O − E)² / E)
O = Observed frequency (number of results obtained experimentally)
E = Expected frequency (number of results predicted theoretically)
Σ = Summation symbol indicating that all categories are added together
—-----------------------------------------------------------------
The value of χ² represents how much the observed data deviate from expected values. A small χ² indicates close agreement with the expected ratio, while a large χ² suggests that the deviation is unlikely to be due to random chance alone.
Steps in Applying the Chi-Squared Test in Genetic Data
Step 1 – Identify the Genetic Cross
Determine which genetic cross is being tested, such as a monohybrid, dihybrid, or sex-linked cross. This defines the expected phenotypic ratio (e.g., 3:1, 9:3:3:1).
Step 2 – Collect and Record Data
Gather observed frequencies for each phenotype category. Accuracy in counting ensures valid statistical outcomes.
Step 3 – Calculate Expected Values
Multiply the total number of offspring by the proportion expected in each category based on Mendelian ratios.
Step 4 – Compute (O − E)² / E for Each Category
For every phenotype, calculate the squared difference between observed and expected frequencies, divided by the expected frequency.
Step 5 – Sum All Categories
Add the results to obtain the χ² value. This provides a single figure representing the overall deviation.
Step 6 – Determine Degrees of Freedom (df)
Degrees of Freedom (df): The number of categories minus one (n − 1). It represents how many values can vary independently when calculating χ².
The degrees of freedom are used to find the critical value from a chi-squared distribution table.
Step 7 – Compare χ² Value to Critical Value
The critical value corresponds to the chosen significance level (commonly 0.05) and degrees of freedom.
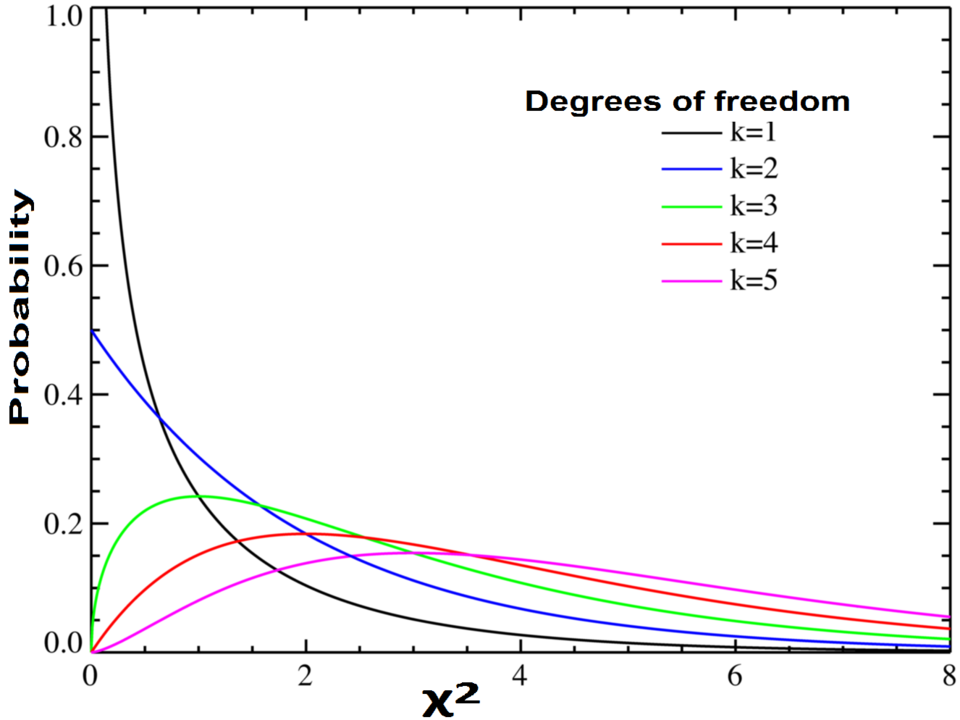
Probability density function of the chi-squared distribution, with χ² on the x-axis and P-value indicated for the right-tail region. Students can see how larger χ² values fall deeper into the tail, crossing the critical value at the chosen significance level. This figure focuses on distribution shape and tail area only; it does not include tables or advanced statistical detail. Source.
If χ² < critical value → Fail to reject H₀: observed deviations are due to chance.
If χ² ≥ critical value → Reject H₀: deviations are statistically significant and likely caused by a biological factor.
Interpretation in a Genetic Context
The chi-squared test does not prove a hypothesis; instead, it helps determine whether data fit expected ratios. In Mendelian genetics:
A non-significant result supports the proposed inheritance pattern (e.g., independent assortment).
A significant result implies another factor, such as linkage (genes located close together on the same chromosome) or epistasis (interaction between genes), affects inheritance outcomes.
Biological and Experimental Considerations
Sample Size
Small sample sizes increase random variation, making results less reliable. Larger sample sizes yield more accurate χ² tests, as the law of large numbers reduces sampling error.
Random Mating and Independent Assortment
The test assumes individuals mate randomly and alleles assort independently. Violations of these assumptions, such as linkage, produce non-Mendelian ratios and higher χ² values.
Environmental Effects
Although the chi-squared test analyses genetic ratios, environmental influences on phenotype (e.g., nutrition, temperature) can affect observed outcomes and contribute to deviation.
The Importance of Significance
The significance level (p-value) indicates the probability that the observed deviation arose by chance. In biological sciences, p ≤ 0.05 is typically used to judge significance. This threshold ensures a balance between Type I errors (incorrectly rejecting H₀) and Type II errors (failing to detect a real effect).
Critical Value: The threshold χ² value beyond which the difference between observed and expected frequencies is statistically significant at a given probability level.
Using this approach allows researchers to make informed conclusions about whether inheritance data align with theoretical expectations.
Applications in Genetics
The chi-squared test is widely applied in:
Mendelian inheritance studies to verify predicted ratios.
Linkage analysis, where significant deviation suggests genes are inherited together.
Epistasis experiments, where gene interactions alter expected phenotypic outcomes.
Breeding programmes, to confirm the inheritance patterns of desired traits.
By quantifying deviation, the chi-squared test acts as a crucial statistical bridge between theory and experimental evidence, reinforcing the reliability of genetic analysis.
Practice Questions
Question 1 (2 marks)
Explain the purpose of the chi-squared (χ²) test in genetics.
Mark Scheme:
1 mark for stating that the chi-squared test compares observed and expected frequencies in genetic data.
1 mark for explaining that it is used to determine whether any difference between observed and expected values is due to chance or another biological factor (e.g. linkage or epistasis).
Question 2 (5 marks)
A genetic cross between two heterozygous plants produced the following offspring:
72 plants with red flowers
28 plants with white flowers
According to Mendelian inheritance, the expected ratio is 3 red : 1 white.
Using the chi-squared (χ²) test, outline how you would determine whether the results differ significantly from the expected ratio. Include all key steps and how to interpret the outcome.
Mark Scheme:
1 mark for stating the null hypothesis (H₀): any difference between observed and expected frequencies is due to chance.
1 mark for describing the calculation of expected values based on the 3:1 ratio.
1 mark for stating the chi-squared formula: χ² = Σ((O − E)² / E).
1 mark for describing the use of degrees of freedom (number of categories − 1) and comparison with a critical value at p = 0.05.
1 mark for explaining interpretation:
If χ² < critical value → fail to reject H₀ (no significant difference; data fit the expected ratio).
If χ² ≥ critical value → reject H₀ (difference significant; another factor may influence inheritance).
FAQ
Small sample sizes increase random variation, making deviations between observed and expected frequencies appear larger or more irregular than they truly are.
Larger samples reduce this variation, providing a more accurate representation of theoretical ratios such as 3:1 or 9:3:3:1. In practice, a small number of offspring may cause the chi-squared test to give misleading significance results, whereas larger datasets improve statistical confidence and reduce the risk of false conclusions.
The test assumes that expected frequencies in each category are large enough (generally at least 5) to approximate a continuous probability distribution.
If expected values fall below this threshold, the chi-squared distribution no longer accurately reflects chance variation, and statistical significance becomes unreliable. In such cases, alternative tests such as Fisher’s exact test are more appropriate, especially for small sample sizes or rare phenotypes.
Several biological phenomena can produce deviations from expected Mendelian ratios:
Gene linkage: genes located close together on the same chromosome are inherited together.
Epistasis: one gene masks or modifies the expression of another.
Lethal alleles: certain genotypes result in non-viable offspring.
Segregation distortion: gametes carrying particular alleles are favoured.
These factors disrupt independent assortment or equal gamete formation, resulting in a higher χ² value and a significant difference from the expected ratio.
Unlike tests that compare means or medians, the chi-squared test evaluates how well observed data match theoretical expectations.
It does not compare two sets of data against each other but rather tests whether one dataset (the observed) “fits” the model predicted by probability (the expected). This makes it particularly useful for inheritance studies, where expected ratios are known in advance based on Mendelian theory.
No, the chi-squared test only indicates whether the overall deviation is statistically significant.
It summarises all categories into a single value (Σ((O − E)² / E)) but does not identify where discrepancies occur. To determine which category contributes most to the deviation, biologists can inspect individual (O − E)² / E values.
This helps pinpoint which phenotype frequencies differ most from predictions, although statistical interpretation still applies to the dataset as a whole.
