
OCR Specification focus:
‘Use phenotypic ratios and explanations to identify autosomal or sex linkage and to interpret epistatic interactions between genes.’
Genetic linkage and epistasis explain how genes interact and are inherited together, influencing phenotypic ratios beyond Mendel’s classic expectations and revealing deeper complexity in genetic inheritance patterns.
Genetic Linkage
The Concept of Linkage
Genes located on the same chromosome are said to be linked, meaning they tend to be inherited together because they are physically close and less likely to be separated during crossing over in meiosis.
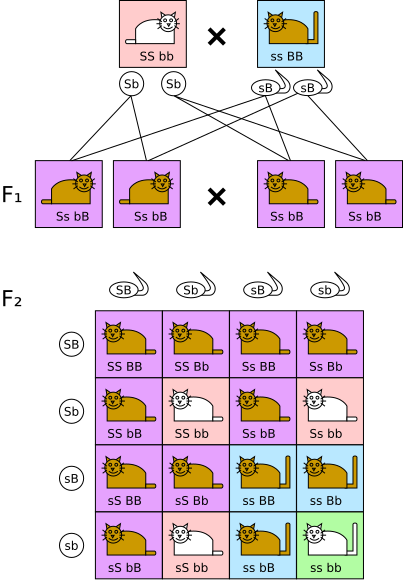
Crossing over between non-sister chromatids during meiosis I can exchange allele segments and generate recombinant chromatids. The proportion of recombinants relates to the distance between loci, helping reveal autosomal linkage. The diagram’s simple A/a and B/b alleles map directly to the inheritance deviations discussed in the notes. Source.
Genetic Linkage: The tendency of genes located close together on the same chromosome to be inherited together during meiosis.
Linked genes do not assort independently, leading to phenotypic ratios that deviate from Mendelian predictions such as the 9:3:3:1 ratio expected for dihybrid crosses.
Autosomal Linkage
When linked genes are found on autosomes (non-sex chromosomes), the inheritance pattern depends on whether crossing over occurs between them.
No crossing over: parental combinations of alleles dominate, producing a 3:1 phenotypic ratio similar to a monohybrid cross.
With crossing over: recombinant offspring appear in smaller numbers, showing new allele combinations.
The frequency of recombinants can be used to estimate the distance between genes on a chromosome; the greater the distance, the higher the chance of crossing over.
Recombinant: An organism whose genotype results from the exchange of genetic material between homologous chromosomes during crossing over.
In dihybrid crosses involving linked autosomal genes, unexpected ratios such as 15:1 or 1:2:1 may indicate linkage rather than independent assortment.
Sex Linkage
Sex linkage occurs when genes are located on the sex chromosomes (X or Y). Because the X and Y chromosomes differ in size and gene content, inheritance of X-linked traits differs between males and females.
Males have one X chromosome and one Y chromosome (XY). Any recessive allele on the X chromosome is expressed, as there is no homologous allele on the Y.
Females have two X chromosomes (XX), so a recessive allele can be masked by a dominant allele.
Examples include haemophilia and colour blindness, both caused by recessive alleles on the X chromosome.
Key features of sex-linked inheritance:
Traits more commonly expressed in males.
No father-to-son transmission of X-linked traits.
Affected fathers pass the allele to all daughters, who become carriers if the allele is recessive.
Carrier: An individual who possesses one copy of a recessive allele that does not produce the phenotype in the heterozygous condition.
These distinctive inheritance patterns help identify sex linkage from pedigree analysis and phenotypic ratios in genetic crosses.
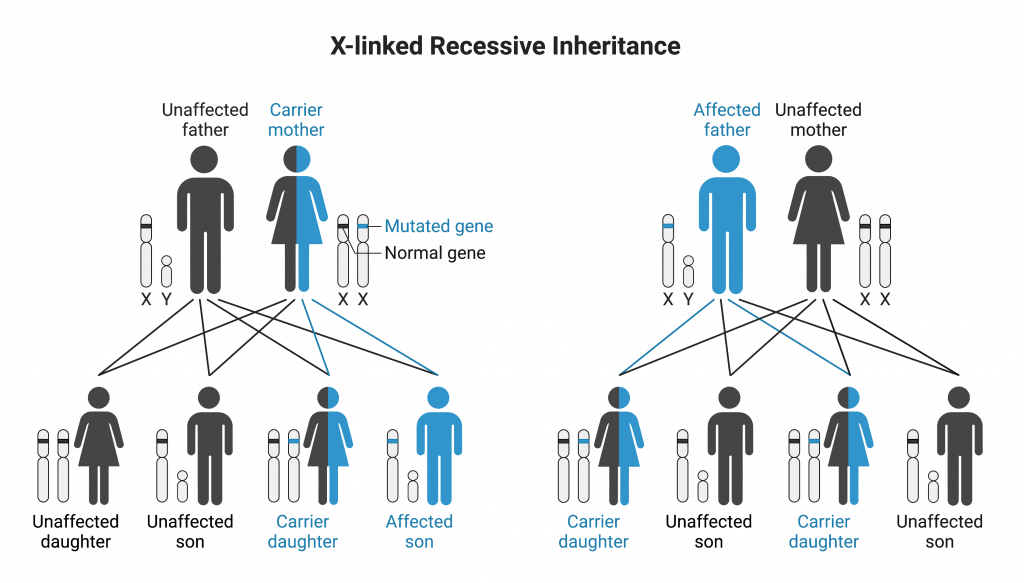
This diagram summarises X-linked recessive inheritance: affected males inherit the mutant X from carrier mothers; daughters of affected fathers are obligate carriers. It reinforces the absence of father-to-son transmission and the higher male incidence, exactly as outlined in the notes. Source.
Identifying Linkage from Phenotypic Ratios
Deviations from the expected Mendelian ratios suggest linkage. In independent assortment, a dihybrid cross (AaBb × AaBb) produces offspring with a 9:3:3:1 ratio. Linked genes, however, yield altered ratios due to limited recombination.
When few recombinant phenotypes are observed, linkage is inferred. The closer two genes are on a chromosome, the lower the recombination frequency. Ratios approaching 3:1 rather than 9:3:3:1 provide strong evidence of linkage.
Epistasis
Definition and Overview
Epistasis occurs when one gene’s expression masks or modifies the expression of another gene at a different locus. This interaction affects the phenotypic ratio of offspring.
Epistasis: The interaction between genes at different loci, where one gene influences or masks the expression of another.
Epistasis can occur through enzyme pathways or structural gene interactions, influencing how phenotypes appear in the organism.
Mechanisms of Epistasis
Different types of epistasis can be classified based on how genes interact:
Recessive epistasis: Two recessive alleles at one locus mask expression of another gene.
Typical modified ratio: 9:3:4 (e.g. coat colour in mice).
Dominant epistasis: A dominant allele at one locus masks another gene’s effect.
Typical ratio: 12:3:1 (e.g. fruit colour in summer squash).
Complementary epistasis: Both genes required for the same phenotype; if either is inactive, the phenotype is not produced.
Ratio: 9:7 (e.g. flower colour in sweet peas).
Duplicate gene interaction: Either of two genes produces the same phenotype.
Ratio: 15:1 (e.g. seed capsule shape in shepherd’s purse).
These ratios result from the way gene products—often enzymes in biochemical pathways—affect one another’s activity.
Molecular Basis of Epistasis
Epistasis often reflects the biochemical relationship between gene products:
Sequential pathways: One gene’s product acts before another in a metabolic chain; a mutation in the first gene prevents production of intermediate substrates, masking the second gene’s effect.
Regulatory control: One gene may code for a transcription factor or regulator that determines whether another gene is expressed.
Structural dependency: Proteins may form complexes; a non-functional subunit from one gene can render the entire complex inactive.
These molecular mechanisms show that phenotype depends not only on single genes but on gene interactions within a network.
Identifying Epistasis from Ratios
Modified dihybrid ratios reveal epistatic interactions. When offspring numbers significantly differ from Mendelian predictions, the nature of the deviation indicates the type of epistasis:
9:3:4 ratio → recessive epistasis
12:3:1 ratio → dominant epistasis
9:7 ratio → complementary genes
15:1 ratio → duplicate gene interaction
Statistical analysis using the chi-squared test (χ²) helps confirm whether deviations are significant or due to random variation.
EQUATION
—-----------------------------------------------------------------
Chi-squared Test (χ²) = Σ((Observed − Expected)² / Expected)
χ² = Measure of deviation between observed and expected frequencies (no units)
—-----------------------------------------------------------------
Values exceeding the critical value at a given probability (usually p = 0.05) indicate that the deviation is significant, suggesting linkage or epistasis rather than independent assortment.
Summary of Key Indicators
When evaluating inheritance data:
Autosomal linkage → fewer recombinant offspring than expected.
Sex linkage → traits expressed differently in males and females.
Epistasis → altered phenotypic ratios due to gene interactions.
Understanding these patterns allows biologists to interpret complex inheritance and to map genes within genomes based on their interactions and recombination frequencies.
Practice Questions
Question 1 (2 marks)
Explain why genes located close together on the same chromosome are usually inherited together.
Mark Scheme:
1 mark for stating that the genes are linked or on the same chromosome.
1 mark for explaining that crossing over is less likely to occur between genes that are close together, so they are usually inherited together.
Question 2 (5 marks)
The flower colour in a certain plant species is determined by two genes, A and B.
Both genes are involved in a two-step pathway: gene A produces an enzyme that converts a colourless precursor into an intermediate, and gene B produces an enzyme that converts the intermediate into a red pigment.
a) Explain how these two genes interact to produce the observed phenotypes.
b) Predict the phenotypic ratio expected in the F2 generation of a dihybrid cross between two heterozygous plants (AaBb × AaBb), and explain your reasoning.
Mark Scheme:
1 mark for identifying that both genes are required to produce the final pigment (complementary epistasis).
1 mark for explaining that if either gene is inactive (homozygous recessive), the pathway is blocked and no pigment (white flowers) is produced.
1 mark for stating that only plants with at least one dominant allele of both genes (A_B_) will produce the red pigment.
1 mark for correctly predicting the 9:7 phenotypic ratio (9 red : 7 white) in the F2 generation.
1 mark for linking the ratio to gene interaction rather than independent additive effects, showing understanding of how epistasis modifies Mendelian ratios.
FAQ
Crossing over frequency depends on the physical distance between genes on a chromosome. The further apart the loci, the more likely a crossover will occur during prophase I of meiosis.
Environmental factors such as temperature and age of the organism can also influence crossover rates.
Recombination frequency is often expressed as map units (centimorgans), where 1% recombination equals 1 cM — a measure used to create linkage maps showing gene order and distances.
Scientists perform test crosses and analyse phenotypic ratios in the offspring.
If the proportion of recombinant phenotypes is significantly lower than expected under independent assortment (9:3:3:1), this suggests linkage.
The chi-squared test helps confirm whether deviations are statistically significant.
A result showing fewer recombinants than predicted by chance supports autosomal linkage.
If recombination still occurs occasionally, it indicates partial linkage rather than complete linkage.
Males have one X and one Y chromosome (XY), so any recessive allele on the X chromosome will be expressed, as there is no corresponding allele on the Y.
Females (XX) require two copies of a recessive allele for the trait to appear, making them more likely to be carriers than affected.
This pattern explains why disorders such as haemophilia and Duchenne muscular dystrophy predominantly affect males but can still be transmitted through carrier mothers.
Yes. Linkage refers to genes being physically close on the same chromosome, while epistasis refers to functional interactions between genes, regardless of location.
Both can act together:
Two epistatic genes might also be linked, affecting how often recombinant phenotypes appear.
This combination can complicate expected phenotypic ratios, producing results that reflect both chromosomal proximity and gene interaction effects.
Understanding both phenomena helps explain non-Mendelian inheritance in complex traits.
Researchers often use mutant strains or gene knockout experiments to analyse how gene interactions affect metabolic pathways.
By comparing phenotypes of single and double mutants, scientists can determine whether one gene’s product depends on another.
For example:
If mutation in either gene halts pigment formation, the genes act complementarily.
If mutation in one gene masks another’s effect, it indicates dominant or recessive epistasis.
These experiments reveal the sequence and hierarchy of genes within biochemical or developmental processes.
