
OCR Specification focus:
‘Process, analyse and interpret qualitative and quantitative experimental results, reaching valid conclusions where appropriate from the evidence collected.’
Introduction
Analysing experimental results involves transforming raw observations into meaningful information. It requires careful processing, interpretation, and reasoning to ensure valid conclusions are supported by reliable data and clear scientific evidence.
Understanding Qualitative and Quantitative Results
Qualitative Results
Qualitative results are non-numerical observations that describe the qualities or characteristics of substances or reactions. These may include:
Colour changes (e.g. blue to colourless in Cu²⁺ reduction)
Formation of precipitates (e.g. silver chloride in halide tests)
Effervescence indicating gas production
Changes in odour or temperature observed during reactions
These observations are typically recorded in words and rely on descriptive accuracy and consistency. They often help to identify substances or confirm reaction mechanisms.
Quantitative Results
Quantitative results involve numerical data that can be measured, calculated, or statistically analysed. Examples include:
Volumes of solutions in titrations
Mass changes during thermal decomposition
Temperature readings in enthalpy experiments
Electrical measurements in electrochemical cells
These results allow for mathematical treatment and data processing, forming the basis for drawing numerically justified conclusions.
Processing Qualitative Data
Recording and Organisation
To ensure validity, qualitative data should be:
Recorded immediately during the experiment to prevent bias
Organised systematically in tables or labelled diagrams
Described objectively, avoiding subjective terms such as “slightly” or “strongly” unless comparative context is clear
For example, instead of noting “slight colour change,” record “solution changed from pale blue to colourless.”
Interpreting Qualitative Data
Interpretation involves linking observations to chemical theory, such as recognising oxidation states, identifying ions, or inferring reaction pathways.
Common reasoning steps include:
Linking colour changes to transition metal oxidation
Identifying precipitation reactions as evidence of insoluble salts
Using gas evolution to confirm decomposition or redox processes
Processing Quantitative Data
Data Organisation and Presentation
Quantitative results must be recorded with:
Appropriate headings and units
Consistent significant figures matching the measuring apparatus
Clear notation distinguishing measured values from calculated ones
Data tables should include columns for raw data, processed data (e.g. mean values), and units for every column.
Data Processing Techniques
Common processing methods include:
Averaging repeated measurements to reduce random error
Calculating mean titres (excluding anomalies) in titration data
Applying corrections, e.g. for zero errors on instruments
Converting units consistently into SI form before analysis
Read liquid volumes at eye level and take the value from the bottom of a concave meniscus (or top of a convex meniscus), avoiding parallax error.
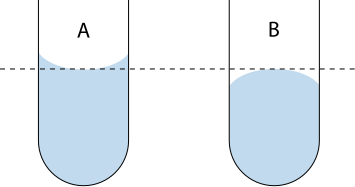
Diagram showing the correct meniscus reading for concave and convex liquids at eye level to minimise parallax error. Accurate readings underpin reliable processed values such as mean titres and uncertainties. Labels indicate the correct reference point on the curve. Source
Mathematical Treatment
Percentage Yield (%) = (Actual Yield / Theoretical Yield) × 100
Actual Yield = Mass of product obtained (g)
Theoretical Yield = Calculated maximum mass of product (g)
This type of calculation allows students to quantify reaction efficiency and assess data reliability.
Data Interpretation and Trend Analysis
Identifying Patterns and Relationships
When processing experimental results, patterns may indicate relationships between variables, such as:
Direct proportionality (e.g. concentration vs. rate)
Inverse relationships (e.g. pressure vs. volume in gases)
Curved trends suggesting non-linear dependence
Interpreting these patterns requires understanding of underlying chemical principles like collision theory or equilibrium dynamics.
Linking Data to Theoretical Models
Students must apply chemical theory to explain observations:
Increasing temperature generally increases reaction rate due to higher kinetic energy.
Decreasing concentration reduces rate as there are fewer collisions per unit time.
In equilibrium studies, data trends should be related to Le Chatelier’s principle.
This stage transforms data into scientific conclusions supported by evidence.
Reliability and Data Integrity
Ensuring Reliable Data
Reliability arises from:
Consistent techniques across repeats
Calibration of apparatus
Elimination of anomalous results identified through data comparison
Repeating measurements enhances precision and helps in assessing repeatability (the ability to obtain similar results under the same conditions).
Recognising Anomalies
Anomalous results deviate significantly from others and may arise due to:
Human error (e.g. misreading volumes)
Equipment faults (e.g. air bubbles in burette)
Environmental factors (e.g. temperature fluctuations)
Anomalies should not be ignored but rather noted and excluded from final calculations with justification.
Record qualitative observations (e.g., colour change, precipitate formation, gas evolution) alongside conditions, as they justify processing decisions such as accepting or discarding measurements.
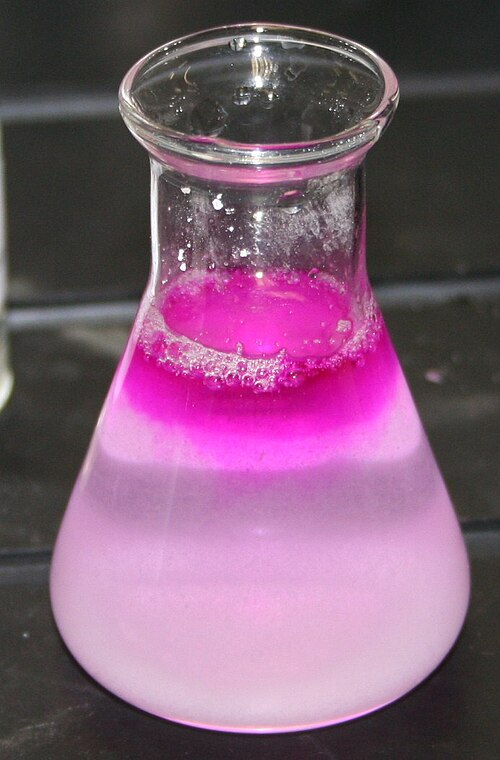
Photograph of an acid–base titration at the phenolphthalein endpoint in a conical flask. The pale pink colour indicates endpoint under typical alkaline conditions. This visual criterion supports consistent judgement when processing titres. Source
Statistical and Mathematical Considerations
Using Averages and Ranges
Statistical tools help summarise data trends:
Mean gives a central value.
Range shows data spread and indicates variability.
Standard deviation (where appropriate) quantifies precision.
Significant Figures
Significant Figures: The digits in a number that contribute to its precision, reflecting the accuracy of the measuring instrument used.
Use the same number of significant figures in processed data as the least precise measurement, ensuring numerical consistency and avoiding overstatement of precision.
Uncertainty and Error Analysis
Percentage Uncertainty (%) = (Absolute Uncertainty / Measured Value) × 100
Absolute Uncertainty = ±Half the smallest instrument division
Measured Value = Recorded reading with unit
This expresses how confident the experimenter can be in a particular measurement and helps in evaluating data accuracy.
Drawing Valid Conclusions
Criteria for Valid Conclusions
A valid conclusion:
Directly addresses the experimental aim
Is supported by processed data and scientific reasoning
Acknowledges uncertainties and limitations in the method
Students should avoid overgeneralising results and must justify every inference using numerical and qualitative evidence.
Integrating Evidence
To finalise conclusions:
Combine quantitative results (e.g. yield, rate constants) with qualitative evidence (e.g. colour change)
Cross-reference data trends with theoretical expectations
Evaluate the degree of agreement between experiment and theory
Plot a calibration graph with correctly labelled axes and units, draw a best-fit line, then determine the gradient and intercept to extract the required relationship or constant.
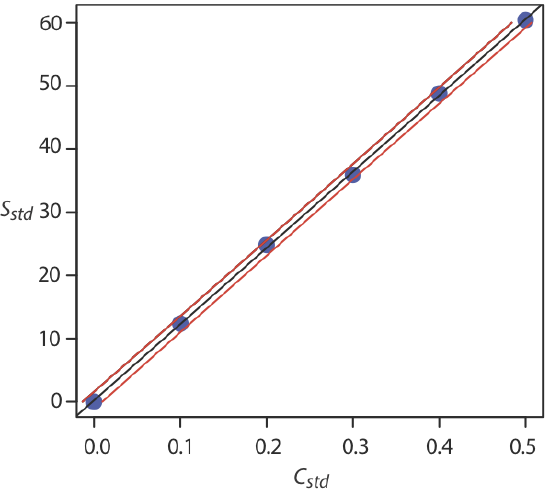
Example calibration curve with experimental points and a fitted straight line; confidence limits are shown for the analyte concentration derived from the line. This illustrates how processed data from replicates are used to obtain quantitative parameters (slope, intercept) for analysis. The plot slightly exceeds syllabus depth by showing confidence bands, but the core features (points, best-fit line, axes) are directly aligned with the specification. Source
Practice Questions
During a titration experiment, a student records three concordant titres: 25.10 cm³, 25.05 cm³, and 25.15 cm³.
(a) Calculate the mean titre to an appropriate number of decimal places.
(b) State why it is important to use concordant titres when processing results.
(2 marks)
(a) Mean titre = (25.10 + 25.05 + 25.15) ÷ 3 = 25.10 cm³ (1 mark for correct calculation and decimal consistency)
(b) Using concordant titres ensures reliability and reduces the impact of random error, improving precision of the final result. (1 mark for clear reasoning)
A student investigates the decomposition of hydrated copper(II) sulfate to form anhydrous copper(II) sulfate and water.
The student records the following mass data:
Mass of empty crucible = 25.32 g
Mass of crucible + hydrated copper(II) sulfate before heating = 28.56 g
Mass of crucible + anhydrous copper(II) sulfate after heating = 27.48 g
(a) Calculate the mass of water lost during heating. (1 mark)
(b) Explain how repeating the experiment and re-heating the sample until constant mass improves the reliability of the data. (2 marks)
(c) Suggest one possible source of error and describe how it could affect the accuracy of the calculated water content. (2 marks)
(5 marks)
(a) Mass of water lost = 28.56 − 27.48 = 1.08 g (1 mark for correct subtraction)
(b) Reheating until constant mass ensures all water is removed and the reaction is complete, eliminating underestimation of water loss. (1 mark for idea of repetition, 1 mark for link to completeness/reliability)
(c) Possible error: Some solid may spatter out during heating or react with air (1 mark). This would cause the measured mass of anhydrous salt to be too low, making the calculated water content appear too high. (1 mark for effect on accuracy)
FAQ
Systematic errors cause consistent deviations in one direction, such as a miscalibrated balance always giving a higher reading. Random errors, by contrast, vary unpredictably between measurements.
To distinguish them:
Compare repeated results — random errors fluctuate around the mean.
Check calibration of equipment — systematic errors affect all results equally.
Identifying which type is present helps determine whether results need correction or improved precision.
Including units and headings ensures clarity, allowing others to interpret and verify your results. A missing unit makes numerical values meaningless, while unclear headings can cause misinterpretation.
In tabulated or graphical data:
Each column or axis must include both the quantity and unit, e.g., “Temperature / °C”.
Headings allow consistent comparison between experiments and ensure that calculations use compatible quantities.
Accuracy refers to how close a result is to the true or accepted value.
Precision describes how close repeated results are to one another.
Reliability involves whether the experiment consistently produces similar results under the same conditions.
An experiment can be precise but inaccurate if systematic error affects all measurements, so both precision and accuracy must be evaluated to judge data quality.
Percentage uncertainty indicates the degree of confidence in a measurement and helps determine whether differences between results are significant.
It allows you to:
Compare uncertainties from different instruments.
Identify whether measurement limitations meaningfully affect conclusions.
Assess whether observed variations exceed experimental error.
Using percentage uncertainty supports the evaluation of precision and improves the overall reliability of processed data.
Anomalies often arise from human or equipment errors, contamination, or uncontrolled environmental conditions. For example:
Incomplete reactions in titrations
Air bubbles in burettes or pipettes
Inconsistent heating during thermal decomposition
When identified, anomalies should be:
Recorded but excluded from mean or graphical analysis
Investigated to prevent recurrence
Justified clearly in evaluation to maintain transparency and scientific integrity.
