
OCR Specification focus:
‘Use significant figures appropriately throughout calculations and reported values, matching the precision of the data.’
Introduction
Significant figures and numerical uncertainty ensure that all quantitative results in chemistry accurately reflect the precision of experimental measurements, avoiding overstatement of accuracy.
Understanding Significant Figures
What Are Significant Figures?
Significant figures (sig. figs) indicate the digits in a measurement that are known with certainty, plus one uncertain or estimated digit. They communicate how precisely a measurement has been made and should match the measuring instrument’s capability.

A close-up of a graduated cylinder showing the scale divisions and the meniscus at eye level. This highlights that the last digit recorded is estimated from the smallest scale division to set the correct number of significant figures. Minor photographic context (finger behind the cylinder for contrast) is extra detail not required by the syllabus but aids visibility. Source
Significant Figures: The digits in a number that express its precision, including all certain digits and the first uncertain one.
For instance, recording a temperature as 23.45 °C indicates greater precision than 23 °C, suggesting that the instrument can measure to two decimal places.
Rules for Determining Significant Figures
When handling experimental data, follow these key rules:
All non-zero digits are significant (e.g. 245 has three significant figures).
Zeros between non-zero digits are significant (e.g. 2005 has four).
Leading zeros (those before the first non-zero digit) are not significant (e.g. 0.0042 has two).
Trailing zeros in a number containing a decimal point are significant (e.g. 2.300 has four).
Trailing zeros without a decimal point are ambiguous and should be written in scientific notation to clarify (e.g. 2300 may be 2, 3, or 4 significant figures depending on context).
These rules prevent errors when comparing and calculating measured quantities.
Applying Significant Figures in Calculations
Addition and Subtraction
When adding or subtracting, the result should retain the same number of decimal places as the measurement with the fewest decimal places.
Multiplication and Division
When multiplying or dividing, the result should have the same number of significant figures as the value with the fewest significant figures.
Failure to follow these conventions leads to misleading results that suggest greater or lesser precision than justified.
Rounding and Reporting
Always round to the correct number of significant figures at the end of a calculation, not during intermediate steps. Premature rounding can propagate error through calculations. When reporting results, include units and maintain consistency across data sets.
Understanding Numerical Uncertainty
What Is Numerical Uncertainty?
Every measurement carries uncertainty, arising from instrument precision and experimental conditions. It quantifies the range within which the true value is expected to lie.
Numerical Uncertainty: The estimated range within which the true value of a measurement lies, reflecting limitations in accuracy and precision.
In chemistry, uncertainty is essential for assessing the reliability of quantitative results, ensuring that conclusions are supported by accurate data interpretation.
Sources of Uncertainty
Common sources include:
Instrument precision (e.g. balance readability ±0.01 g)
Human error in reading scales or timing reactions
Environmental factors such as temperature fluctuation
Method limitations where measurement techniques cannot achieve higher precision
Understanding these sources allows chemists to design better-controlled experiments.
Expressing Uncertainty
Uncertainty should always be expressed using the same unit as the measurement. For example:
Mass = 2.45 ± 0.01 g
This indicates that the true mass lies between 2.44 g and 2.46 g.
Percentage Uncertainty (%) = (Absolute uncertainty ÷ Measured value) × 100
Absolute uncertainty = ± half the smallest instrument division
Measured value = recorded measurement in appropriate units
This formula quantifies how large the uncertainty is relative to the measurement, helping evaluate data quality.
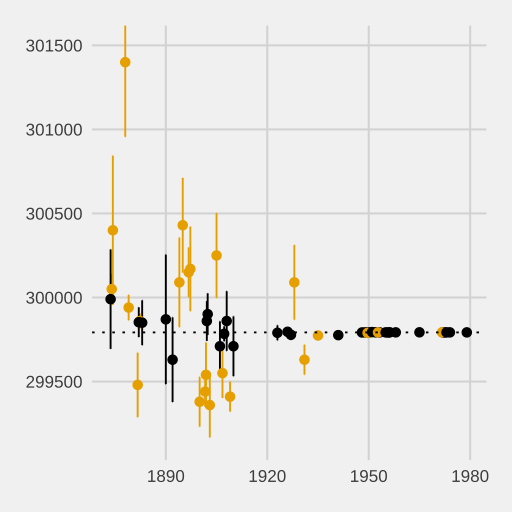
A line chart with data points and vertical error bars expressing measurement uncertainty. The height of each error bar indicates the range within which the true value plausibly lies. Historical details of the dataset are extra and not required by OCR; the plot is used purely to illustrate uncertainty display conventions. Source
Combining Uncertainties
For Addition and Subtraction
When combining measured quantities by addition or subtraction, absolute uncertainties are added:
Total uncertainty = sum of individual absolute uncertainties.
For Multiplication and Division
When combining quantities by multiplication or division, percentage uncertainties are added:
Total percentage uncertainty = sum of individual percentage uncertainties.
This ensures that overall uncertainty reflects combined measurement limitations.
Significance of Significant Figures in Reporting Uncertainty
The uncertainty itself dictates how many significant figures should appear in the final reported value. Generally:
Uncertainty is quoted to one significant figure (two if the first digit is 1).
The measured value should be rounded to match the decimal place of the uncertainty.
For example:
Temperature = 25.36 ± 0.12 °C
Here, the uncertainty has two significant figures (since the first digit is 1), so the temperature is expressed to the same precision.
Accuracy, Precision, and Their Relationship to Significant Figures
Accuracy
Accuracy describes how close a measured value is to the true value. It depends on the systematic errors in an experiment.
Accuracy: The degree to which a measurement agrees with the true or accepted value.
Precision
Precision refers to how closely repeated measurements agree with each other, reflecting the instrument’s resolution and repeatability.
Precision: The consistency or reproducibility of a set of measurements under unchanged conditions.
While a precise result may not be accurate (if all readings are offset by a systematic error), a highly accurate result must also be precise. The correct use of significant figures ensures that reported values convey realistic precision.
Best Practices for Using Significant Figures and Uncertainty
Chemistry students should consistently:
Match significant figures in calculated results to the precision of their data.
Include units and uncertainties in all quantitative results.
Record measurements using the smallest scale division of the instrument.
Propagate uncertainties correctly through multi-step calculations.
Report final results in the form (value ± uncertainty), ensuring coherence between both.
These practices guarantee reliability, repeatability, and validity in data interpretation — aligning with OCR expectations for quantitative analysis and evaluation.
Practice Questions
A student measures the volume of a gas as 24.60 cm³ using a gas syringe marked to the nearest 0.10 cm³.
(a) State the number of significant figures in the recorded value.
(b) Determine the absolute uncertainty in the measurement.
(2 marks)
(a) 4 significant figures — 1 mark
(b) ±0.05 cm³ (half the smallest division) — 1 mark
A student determines the mass of magnesium metal used in a reaction to be 0.125 g ± 0.001 g and measures the volume of hydrogen gas produced as 78.2 cm³ ± 0.4 cm³.
(a) Calculate the percentage uncertainty in the mass measurement.
(b) Calculate the percentage uncertainty in the gas volume measurement.
(c) Determine the total percentage uncertainty in the experiment if both measurements contribute to the overall error.
(d) State the appropriate number of significant figures the final result should be reported to, explaining your reasoning.
(5 marks)
(a) (0.001 ÷ 0.125) × 100 = 0.8% — 1 mark
(b) (0.4 ÷ 78.2) × 100 = 0.5% — 1 mark
(c) Total uncertainty = 0.8% + 0.5% = 1.3% — 1 mark
(d) Final result reported to 2 significant figures, matching the precision of the uncertainty (first digit is 1) — 2 marks (1 mark for reasoning, 1 mark for correct number of significant figures)
FAQ
Absolute uncertainty is the numerical range around a measured value, usually expressed with the same unit (e.g. ±0.01 g).
Relative uncertainty, also known as fractional or percentage uncertainty, compares the absolute uncertainty to the measured value, indicating the uncertainty’s significance.
Formula:
Relative uncertainty = (Absolute uncertainty ÷ Measured value) × 100
This helps compare the reliability of measurements taken using different apparatus.
Repeating measurements reduces random error, helping identify consistent trends and anomalous results.
To reduce uncertainty:
Take at least three repeat readings.
Calculate the mean value, excluding anomalies.
Use instruments with finer scale divisions to reduce absolute uncertainty.
This process enhances precision without altering the true value of the measurement.
Reporting more significant figures than an instrument can justify falsely suggests greater accuracy.
For instance, using a balance that reads to 0.01 g should not yield a result of 0.01234 g, since extra digits imply non-existent precision.
Matching significant figures ensures results accurately reflect the measuring device’s capability, improving consistency and comparability between experiments.
When several measurements are used to calculate a result, their uncertainties must be combined appropriately:
Addition/Subtraction: Add absolute uncertainties.
Multiplication/Division: Add percentage uncertainties.
This ensures the final uncertainty reflects the overall potential error from all contributing measurements, preventing underestimation of data variability.
Rounding too early introduces rounding errors that propagate through calculations, distorting final results.
Instead, retain one or two extra digits in intermediate steps and round only at the end.
This maintains numerical integrity while ensuring the final reported value has the correct number of significant figures consistent with the original data’s precision.
