
OCR Specification focus:
‘Use appropriate mathematical skills for the analysis of quantitative data, as listed in Section 5 of the specification.’
Mathematical analysis in chemistry enables accurate interpretation of experimental data. Students must master numerical handling, ratios, proportional reasoning, and algebraic manipulation to derive valid conclusions from results.
The Role of Mathematics in Data Analysis
Mathematical competence is essential for quantitative chemistry. Accurate calculations allow chemists to assess relationships between variables, determine reaction rates, and evaluate chemical quantities. Proficiency in numerical and graphical manipulation underpins the reliability of all experimental conclusions.
Quantitative Data and Its Treatment
Quantitative data refers to numerical measurements obtained during experiments, such as volumes, masses, concentrations, and temperatures. The analysis of such data requires systematic mathematical processing to convert raw measurements into meaningful information.
Processing Data
Students must perform correct arithmetical operations, maintain consistent units, and apply appropriate significant figures. Key steps include:
Converting between units (e.g., cm³ to dm³).
Applying ratios in stoichiometric relationships.
Calculating means from repeated measurements.
Determining gradients and intercepts from plotted data.
Use a line of best fit to quantify the linear relationship and estimate gradient and intercept.
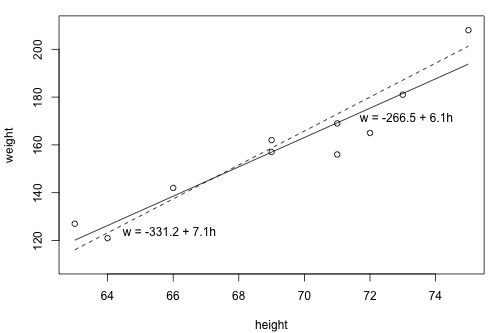
Scatter plot of height (x) versus weight (y) with two fitted straight lines. The solid line gives a better least-squares fit than the dashed line, illustrating how slope and intercept are obtained from linear data. Axes are labelled with quantities and units as expected at A-Level. Source
Mathematical handling transforms raw data into usable results that can support valid scientific reasoning.
Core Mathematical Concepts in Chemistry
Arithmetic and Ratios
Basic arithmetic operations underpin all quantitative analysis. Ratio calculations are particularly vital for balancing equations and determining empirical and molecular formulae.
Ratio: The quantitative comparison between two or more quantities, showing how many times one value contains another.
Ratios help relate moles, volumes, and concentrations in reactions, ensuring the correct proportional use of reactants.
Percentages and Percentage Yield
Percentage calculations are widely used to assess reaction efficiency or purity of substances.
Percentage Yield (%) = (Actual Yield / Theoretical Yield) × 100
Actual Yield = Mass of product obtained (g)
Theoretical Yield = Maximum possible mass (g)
These calculations provide insight into experimental performance and material loss.
Uncertainty and Error Propagation
Mathematical understanding is essential when handling uncertainty. Each measurement carries a potential error that can propagate through calculations. Students must:
Add or subtract absolute uncertainties when combining data.
Multiply or divide percentage uncertainties for proportional calculations.
Uncertainty: The range within which the true value of a measurement is expected to lie, based on limitations of the measuring instrument.
Accurate propagation ensures reported results reflect their true reliability.
Use of Averages and Outlier Identification
Averages reduce random error and improve data precision. When multiple trials are taken, identifying and excluding anomalous results helps improve reliability.
Mean: The sum of all data values divided by the number of values.
Consistency in measurement and correct averaging support valid comparisons across experiments.
Algebraic Manipulation in Chemistry
Many chemical relationships are expressed algebraically, such as rate equations, gas laws, and equilibrium expressions. Students must rearrange formulae confidently to isolate unknown variables.
Ideal Gas Equation (pV = nRT)
p = Pressure (Pa)
V = Volume (m³)
n = Amount of gas (mol)
R = Gas constant (8.31 J mol⁻¹ K⁻¹)
T = Temperature (K)
Manipulating such expressions allows determination of unknown quantities from experimental data.
Logarithmic and Exponential Relationships
Many chemical laws involve exponential or logarithmic trends, notably in pH, rate laws, and half-life calculations. Students must be able to apply logarithmic operations correctly.
Logarithm: The power to which a base number must be raised to obtain a given number; commonly used in chemistry for expressing concentration-related data (e.g., pH = –log₁₀[H⁺]).
An understanding of these relationships enables chemists to linearise curves, making data easier to interpret and compare.
Proportionality and Direct/Inverse Relationships
Recognising proportional relationships is crucial in identifying trends within data.
Direct proportionality: When one variable increases, the other increases proportionally (e.g., volume and moles in gas behaviour).
Inverse proportionality: When one variable increases, the other decreases proportionally (e.g., pressure and volume in gases).
Recognising direct and inverse proportionality helps select appropriate linear or logarithmic transformations before analysis.
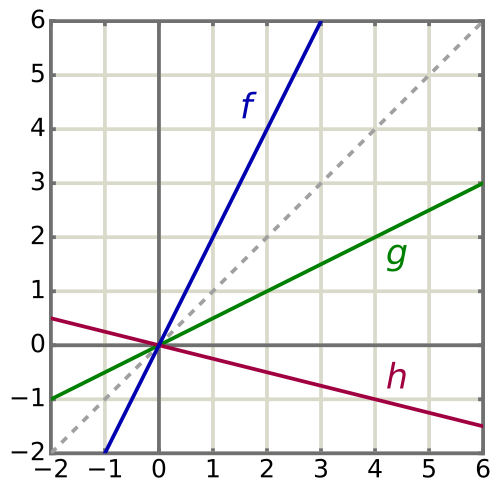
Multiple straight lines through the origin illustrate direct proportionality, y ∝ x, with differing gradients. Such plots help decide whether a linear model is appropriate and how slope relates to proportional constants. Axes are clean and uncluttered; units would be added for a specific experiment. Source
Direct Proportion: y ∝ x → y = kx
Inverse Proportion: y ∝ 1/x → y = k/x
k = Constant of proportionality
Plotting these relationships allows chemists to deduce constants and confirm theoretical models.
Graphical Analysis and Mathematical Modelling
Graphs provide a visual method for interpreting mathematical relationships. Accurate plotting and scale selection are essential for meaningful results.
Students should:
Label axes with quantities and units.
Choose suitable linear or logarithmic scales.
Use best-fit lines rather than connecting data points directly.
Plot error bars to communicate measurement uncertainty clearly, stating whether they represent SD, SE or a confidence interval.
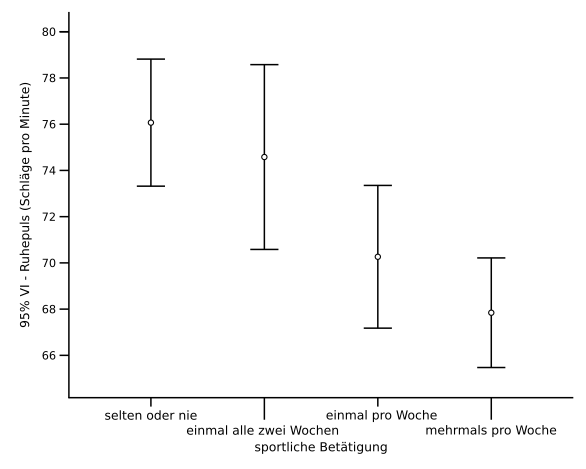
Bar chart with vertical error bars drawn as red lines to denote 95% confidence intervals. The figure highlights that error bars express variability and must be specified (e.g., SD, SE, or CI). Extra detail beyond the syllabus: the specific confidence level (95%) is shown. Source
From such plots, gradients and intercepts are calculated to determine key constants such as rate constants or activation energy.
Gradient: The rate of change of one variable with respect to another, calculated as rise over run (Δy/Δx).
Graphical representation allows for straightforward evaluation of how one chemical variable depends on another.
Proportional Reasoning and Stoichiometry
Stoichiometry is one of the most significant mathematical applications in chemistry. It connects the theoretical and experimental aspects by using mole ratios to predict outcomes.
Students must:
Convert between mass, moles, and volume using molar relationships.
Interpret balanced equations to find limiting reagents.
Apply proportional reasoning to calculate expected yields or concentrations.
Such quantitative problem-solving underpins both practical and theoretical chemistry.
Statistical Treatment of Data
Mathematical analysis sometimes requires applying basic statistical tools to assess the quality of data. These include:
Calculating range, mean, and standard deviation.
Using percentage error to compare observed and theoretical values.
Assessing precision and reproducibility through numerical measures.
Standard Deviation: A measure of how spread out data values are from the mean, indicating the degree of variability in results.
These tools help students distinguish between random variation and genuine experimental error.
Mathematical Competence in OCR Chemistry
Throughout OCR A-Level Chemistry, the specification expects students to demonstrate confidence with ratios, proportions, percentages, logarithms, algebra, and graphical methods. Consistent mathematical accuracy ensures that experimental data can be correctly interpreted, supporting valid, evidence-based conclusions.
By mastering these mathematical skills, students can process quantitative results with precision, as required by the OCR specification.
Practice Questions
A student measures the concentration of a sodium hydroxide solution and records the following titres: 25.10 cm³, 25.30 cm³, and 25.20 cm³. Calculate the mean titre and state the number of significant figures in your final answer.
(2 marks)
1 mark for correctly identifying the mean titre calculation: (25.10 + 25.30 + 25.20) / 3.
1 mark for correct answer: 25.20 cm³ (4 significant figures).
A student investigates the rate of reaction between magnesium and hydrochloric acid. The student records the volume of hydrogen gas produced over time and plots a graph of volume (y-axis) against time (x-axis).
(a) Describe how the student would use the graph to determine the rate of reaction at a specific time. (2 marks)
(b) Explain how the gradient of the graph is related to the rate of reaction. (2 marks)
(c) Suggest one way in which mathematical analysis could be used to improve the reliability of the rate data. (1 mark)
(5 marks)
(a)
1 mark for drawing a tangent to the curve at the chosen time.
1 mark for calculating the gradient of the tangent (Δy/Δx) to determine rate in cm³ s⁻¹.
(b)
1 mark for stating that the gradient represents the rate of change of volume with time.
1 mark for explaining that a steeper gradient indicates a faster rate of reaction.
(c)
1 mark for suggesting a suitable mathematical improvement, e.g. “Use computer software to fit a curve and calculate the derivative at each point” or “Take multiple gradients and average them to reduce random error.”
FAQ
Students are often assessed on their ability to manipulate equations, perform proportional reasoning, and calculate gradients, intercepts, and percentage errors. They must also demonstrate correct use of significant figures and units.
Commonly tested areas include:
Rearranging equations to isolate variables.
Using logarithmic relationships (e.g., for pH or rate laws).
Interpreting data from graphs to determine constants or reaction rates.
Significant figures show the precision of measurements. Using too many implies greater accuracy than the equipment allows, while too few reduces precision.
When performing calculations:
The final answer should match the least precise measurement used.
Consistent use of significant figures avoids rounding errors during multi-step calculations.
Gradients represent the rate of change between two variables and are essential in identifying relationships. For example, the gradient of a rate–time graph gives the rate of reaction.
Steeper gradients indicate faster changes, while flatter slopes show slower variation. This allows chemists to interpret reaction behaviour quantitatively.
Several approaches can minimise uncertainty and improve result reliability:
Take repeated measurements and calculate a mean value.
Use higher precision instruments.
Include error bars on graphs to visualise uncertainty.
Propagate percentage uncertainties through calculations for a full error assessment.
Proportional reasoning helps determine whether two variables are directly or inversely related. It simplifies data interpretation and model validation.
For example:
A direct proportion (y ∝ x) indicates one variable increases as the other increases.
An inverse proportion (y ∝ 1/x) shows one variable decreases as the other increases.
Recognising these patterns enables accurate predictions and verification of theoretical models.
