
OCR Specification focus:
‘Use mass spectrometry data to find isotopic masses and abundances, and calculate relative atomic mass of an element.’
Introduction
Mass spectrometry enables chemists to determine isotopic masses and abundances, allowing accurate calculation of an element’s relative atomic mass. This subsubtopic explains the principles required for OCR A-Level Chemistry.
Mass Spectrometry: Purpose and Context
Mass spectrometry is an analytical technique used to identify isotopes in a sample and measure their relative abundances.
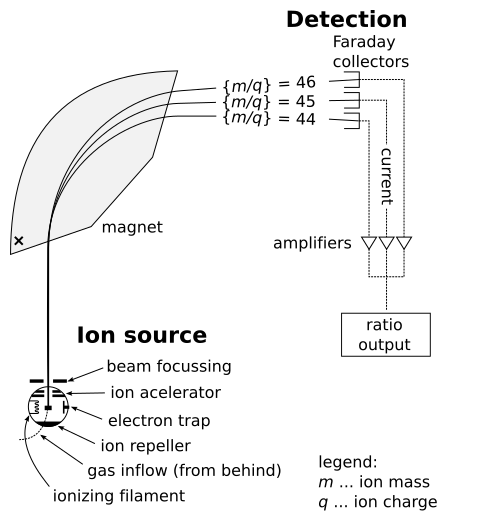
Schematic diagram of a typical mass spectrometer, showing ionisation, acceleration, deflection in a magnetic field, and detection of ions. Ions with different mass-to-charge ratios follow different curved paths and reach the detector at different positions, which produces the mass spectrum. Extra details such as the vacuum system and gas inlet are shown but are not required by the OCR specification. Source
OCR requires students to understand how mass spectrometry provides isotopic masses and percent or fractional abundances, which are then used to calculate the relative atomic mass (Ar) of an element. Only the conceptual steps are required here; instrumental mechanisms such as ionisation modes and vacuum design fall outside the OCR scope.
Understanding Isotopic Mass and Abundance
When an element contains multiple isotopes, each isotope contributes differently to the overall atomic mass based on how common it is in nature. A mass spectrum displays a series of peaks, each corresponding to an isotope with a particular mass-to-charge ratio

Mass spectrum of boron showing isotope peaks at m/z 10 and 11 with different relative abundances. The taller peak represents the more abundant isotope, and the shorter peak the less abundant one. This type of spectrum is used to calculate relative atomic mass using weighted isotopic contributions. Source
A mass spectrum displays a series of peaks, each corresponding to an isotope with a particular mass-to-charge ratio (m/z) and relative abundance.
Key Features of a Mass Spectrum
Each peak represents a positive ion formed from an isotope.
The m/z value on the x-axis corresponds to the mass of the ion (charge is usually +1 at this level).
The peak height or labelled abundance represents the isotope’s percentage or relative proportion.
The combined data allow determination of isotopic masses and their relative abundances, which are essential for calculating Ar.
Before proceeding, two terms must be defined.
Relative isotopic mass: The mass of an atom of a specific isotope compared with one-twelfth of the mass of a carbon-12 atom.
A mass spectrum provides these relative isotopic masses directly on the m/z scale. It is important to recognise that mass spectrometry compares masses relative to the carbon-12 standard, meaning the scale is consistent across all elements.
Normal sentence between definition blocks.
Isotopic abundance: The proportion of each isotope present in a sample, expressed as a percentage or a fraction of the total amount of the element.
These abundances determine the weighted contribution of each isotope when calculating relative atomic mass.
Calculating Relative Atomic Mass (Ar) from Mass Spectrometry
The relative atomic mass listed in the periodic table is not usually a whole number because it reflects the weighted average of all naturally occurring isotopes. OCR requires that students use isotopic masses and abundances from a mass spectrum to determine this average.
A sentence must appear here before an equation block.
Relative Atomic Mass (Ar) = Σ(isotopic mass × isotopic abundance) ÷ 100
Isotopic mass = Mass number or m/z value of the isotope
Isotopic abundance = Percentage abundance or relative proportion
If abundances are given as fractions rather than percentages, division by 100 is not required.
Interpreting Mass Spectrometry Data
OCR expects students to read and interpret simple mass spectra that show isotopic peaks clearly. The steps generally followed are:
Step-by-Step Interpretation
Identify all isotopic peaks and record their m/z values.
Locate the accompanying abundances, which may be numerical labels or proportional peak heights.
Check whether abundances are percentages or relative values, as this changes how the Ar equation is applied.
Multiply each isotopic mass by its abundance, ensuring consistency in units.
Sum all calculated values.
Divide by the total abundance (e.g., 100% or the sum of all relative abundances).
Record Ar to an appropriate number of significant figures, usually matching the precision of the data given.
These steps build the conceptual link between experimental mass spectra and theoretical atomic structure.
Ionisation and Detection in OCR Context
Although OCR does not require detailed mechanistic descriptions, it is essential to understand the fundamental processes that make mass spectrometry possible.
Core Stages (Conceptual Only)
Ionisation: Atoms are converted into positive ions (typically +1) so they can be accelerated and detected.
Acceleration: Ions are propelled through an electric field so they achieve similar kinetic energies.
Deflection or separation: Due to magnetic or electric fields, ions separate according to m/z, allowing isotopes to form distinct peaks.
Detection: Ions strike a detector, generating a signal proportional to abundance.
Normal sentence before definition.
Mass-to-charge ratio (m/z): The numerical value recorded for each ion in a mass spectrum, representing its mass divided by its charge.
Since most ions in A-Level mass spectrometry have a +1 charge, the m/z value often effectively equals the mass of the isotope.
Importance of Mass Spectrometry in Atomic Structure
Mass spectrometry provides evidence for the existence of isotopes and supports the concept that elements consist of atoms with the same number of protons but different numbers of neutrons. Calculated Ar values reflect these isotopic distributions and confirm that atomic masses are not whole numbers. Understanding this method reinforces key ideas from atomic structure, particularly isotopes and atomic mass scales.
Practice Questions
A sample of element X contains two isotopes:
Isotope X-29 with an abundance of 60%
Isotope X-30 with an abundance of 40%
Calculate the relative atomic mass of element X.
Give your answer to 1 decimal place.
(2 marks)
Expected answer: 29.4
Correct method: (29 × 0.60) + (30 × 0.40) (1 mark)
Correct final answer to 1 decimal place: 29.4 (1 mark)
A mass spectrum of an element shows three peaks at m/z 24, 25 and 26.
The relative abundances of the peaks are shown below:
m/z 24: 79%
m/z 25: 10%
m/z 26: 11%
(a) Explain what is meant by the term mass-to-charge ratio (m/z). (2 marks)
(b) Using the data above, calculate the relative atomic mass of the element. Show your working. (3 marks)
(5 marks)
(a)
States that m/z is the mass of an ion divided by its charge (1 mark)
States that for singly charged ions, m/z is numerically equal to the isotope’s mass (1 mark)
(b)
Working:
(24 × 79) + (25 × 10) + (26 × 11) = 1896 + 250 + 286 = 2432
2432 ÷ 100 = 24.32
Multiplies each isotopic mass by its abundance (1 mark)
Sums the products correctly (1 mark)
Divides by total abundance and gives a final answer of 24.3–24.32 (rounding accepted) (1 mark)
FAQ
Different ionisation methods can change how easily atoms form positive ions, which may influence peak intensity.
Electron impact ionisation typically produces simple spectra with clear isotopic peaks.
In contrast, softer ionisation methods (such as electrospray) may form clusters or fragment less, although these methods are not usually examined at A-Level.
Only the overall pattern of isotopic peaks is assessed in OCR A-Level Chemistry, not the ionisation mechanism itself.
Elements with many stable isotopes, such as tin or lead, show numerous peaks because each isotope contributes a separate m/z value.
A complex spectrum may also arise if the element forms isotopic clusters or if the detector is sensitive enough to show very minor isotopes at low abundance.
OCR focuses on interpreting straightforward cases, usually with up to three isotopes.
Relative atomic mass values can differ slightly due to variations in natural isotopic abundance across geographical samples.
Further variation may occur because some data sources round values differently or update them when more precise global measurements become available.
These differences are usually very small and have no impact on exam calculations.
When ions enter the magnetic field, those with greater mass experience a smaller deflection because they have more inertia.
The magnetic force acts equally on singly charged ions, but heavier ions curve less, causing them to be detected at different positions.
This principle is essential for separating isotopes on the basis of m/z.
A highly sensitive detector can reveal low-abundance isotopes that may not appear in less sensitive instruments.
This can result in additional minor peaks, but their presence does not affect the identification of the main isotopes used to calculate relative atomic mass.
OCR questions normally use simplified spectra where all relevant isotopes are clearly shown.
