
OCR Specification focus:
‘Use measurements of mass change, gas volume, or time to investigate reaction rates, with appropriate practical techniques and data handling.’
Measuring reaction rates experimentally allows chemists to monitor how quickly reactants are used or products form. Reliable methods require accurate measurements, controlled variables, and clear links between observable changes and reaction progress.
Measuring Rates: Core Principles
Understanding reaction rates involves tracking a measurable physical change that occurs as a reaction proceeds. Rate is typically determined by assessing how a chosen variable changes with time, enabling the construction of graphs or comparison of rates under different conditions.
A reaction rate is the change in concentration of a reactant or product per unit time.
Reaction Rate: The change in concentration of reactant or product per unit time.
Reliable measurement depends on selecting a suitable technique aligned with the reaction’s behaviour, ensuring the change can be recorded with sufficient precision and frequency.
Choosing Appropriate Techniques
Reactions must produce an observable change that correlates consistently with the progress of the reaction. Three key experimental approaches emphasised by the OCR specification are:
Measuring mass change
Measuring gas volume produced
Measuring time taken for a visible event
These are supported by appropriate procedural choices, careful data collection, and awareness of limitations.
Mass Change Techniques
Monitoring Loss of Mass
This technique is especially valuable when gaseous products escape during the reaction. The reaction mixture is placed on a balance, and the mass is recorded at regular intervals.
Key considerations include:
Use of a top-pan balance with high precision
Ensuring the container allows gases to escape without significant evaporation of liquids
Minimising drafts and vibrations that destabilise readings
Recording mass at consistent time intervals to generate reliable rate curves
Mass loss is directly proportional to the quantity of gaseous product formed, assuming no other mass changes occur.
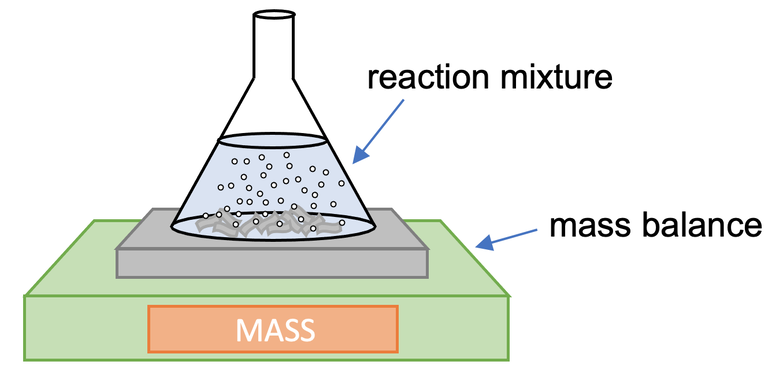
Diagram showing a conical flask on a digital balance, with gas bubbles forming and escaping as the reaction proceeds, allowing mass–time data to be used to determine reaction rate. Source
Suitable Reaction Types
Decomposition producing CO₂
Acid–carbonate reactions
Metal–acid reactions evolving H₂
These reactions generate data that can be plotted as mass vs time, where steeper gradients indicate faster rates.
Gas Volume Techniques
Collecting Gas Volumes
Where gaseous products are produced, gas collection provides a clear and continuous measure of reaction progress. Common apparatus setups include a gas syringe or upturned measuring cylinder in a water trough.
Advantages of gas syringes:
High accuracy, typically ±0.5 cm³
Suitable for most gases unless highly soluble in water
Advantages of water trough collection:
Simple and inexpensive
Useful for insoluble gases such as hydrogen
Procedural Notes
Ensure airtight connections to prevent gas leakage
Use clamps to secure syringes or cylinders
Record gas volume frequently at the start when rate is highest
Maintain constant temperature to avoid gas expansion errors
Volume-time graphs can be used to estimate initial rates from early gradients.
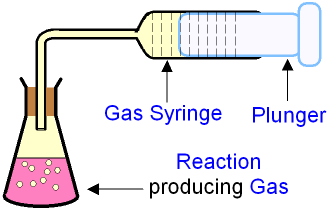
Diagram showing a conical flask connected to a gas syringe used to collect gaseous product. The syringe scale allows volume measurements at timed intervals, supporting rate calculations. Source
Time-Based Methods
Measuring Time for Visible Change
Some reactions produce a qualitative change that occurs at a reproducible point in the reaction. Monitoring time taken allows rate comparisons under different conditions.
Common examples include:
Appearance of a precipitate causing a cross beneath a flask to disappear
Colour changes due to reaction progress
Disappearance of a coloured reactant
These methods indirectly measure rate but offer practical value when other variables cannot be quantified easily.
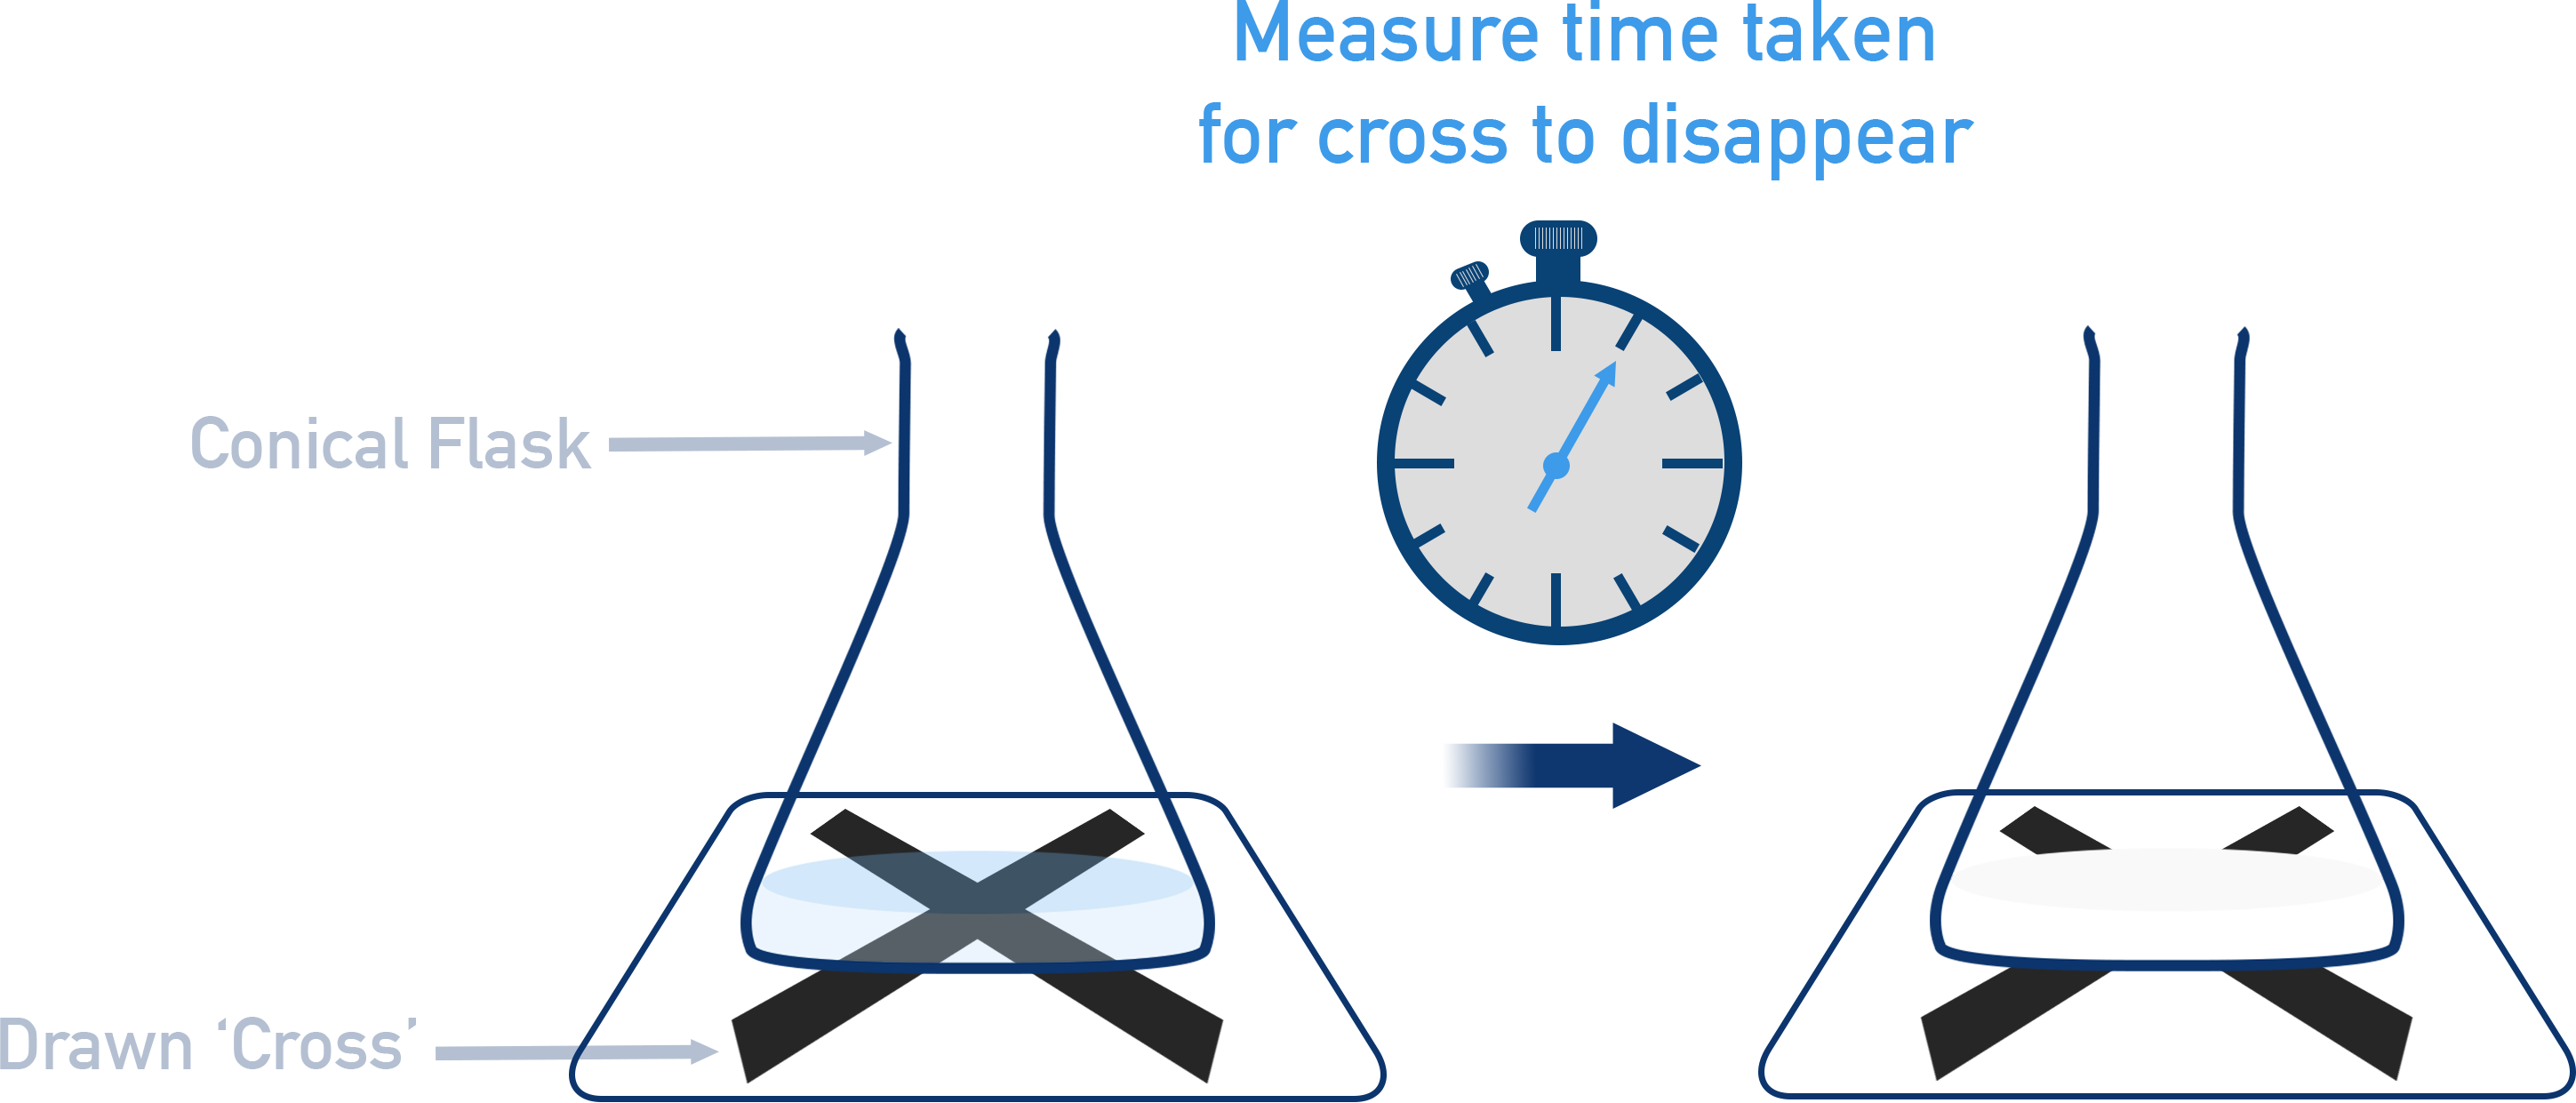
Schematic of the disappearing cross experiment in which sulfur precipitate gradually obscures a cross, allowing the time for a visible change to be measured as an indicator of reaction rate. Source
Reliability Considerations
Human judgement introduces variability
Use consistent viewing angles
Ensure uniform lighting conditions
Repeat measurements and average times for improved accuracy
Such techniques allow comparison of how concentration, temperature or catalyst presence influences reaction speed.
Data Handling and Graphical Treatment
Quantitative techniques generate datasets that can be plotted to examine rate trends. For continuous measurements such as mass or gas volume, rate is obtained from the gradient of the curve at any chosen point.
Rate (of reaction) = Change in measured variable ÷ Time
Change in measured variable = Mass loss, gas volume, or alternative observable; expressed with appropriate units
Time = Duration of measurement; seconds or minutes
Between data collection and interpretation, good practice includes:
Tabulating raw data systematically
Recording uncertainties of apparatus
Using appropriate graph scales
Identifying anomalous results and repeating if necessary
Considering whether initial or mean rates are more appropriate
These actions support accuracy and help meet OCR’s expectation of appropriate practical techniques and data handling.
Practical Techniques: Ensuring Accuracy
Controlling Variables
To maintain reliability and allow valid comparisons, the following must be controlled:
Temperature, which significantly influences kinetic energy and rate
Concentration of reactants
Volume of solutions
Surface area of solids, particularly in heterogeneous reactions
Catalyst presence or absence
Changing only one variable at a time ensures the effect on rate can be meaningfully interpreted.
Recording Data Effectively
Well-designed recording strategies improve precision:
Use electronic timers for consistent time measurement
Pre-weigh reactants to minimise delays
Start timing immediately upon mixing
Use repeat trials to improve reliability and identify systematic deviations
Consider the need for stirring to maintain homogeneity
Each technique should be matched to the reaction’s features and the level of precision required.
Safety and Good Laboratory Practice
Although not directly measured as part of the rate experiment, safety underpins all practical work:
Wear goggles when handling acids or reactive metals
Consider pressure build-up when collecting gases
Avoid using sealed containers for gas-evolving reactions
Dispose of reactants according to school and regulatory guidelines
Safe practice ensures repeatability and reliability while supporting the development of competent experimental technique.
Practice Questions
A student investigates the rate of reaction between magnesium and hydrochloric acid by measuring the volume of hydrogen gas produced over time.
Explain why a gas syringe is more suitable than an inverted measuring cylinder for collecting the gas.
(1–3 marks)
Award up to 3 marks for the following points:
Gas syringes provide more accurate volume measurements (1 mark)
Gas syringes prevent loss of gas because the system can be made airtight (1 mark)
Inverted measuring cylinders may allow gas to dissolve in water or escape during setup, reducing accuracy (1 mark)
A reaction between sodium thiosulfate and hydrochloric acid forms a precipitate of sulfur, causing a cross beneath the reaction flask to disappear from view.
A student uses this setup to compare rates at different temperatures.
Discuss the strengths and limitations of this method for determining reaction rate, and describe how the student should collect and process the data to obtain comparable rate values.
(4–6 marks)
Award marks for any valid points below, up to 6 marks total.
Strengths (maximum 2 marks):
Method gives a clear visual endpoint (1 mark)
Useful for comparing relative rates under different conditions (1 mark)
Limitations (maximum 2 marks):
Human judgement introduces uncertainty when deciding when the cross ‘disappears’ (1 mark)
Turbidity increases gradually, so the endpoint is subjective and may vary between repeats (1 mark)
Lighting or viewing angle can affect when the cross is judged to vanish (1 mark)
Data collection and processing (maximum 3 marks):
Student should measure the time taken for the cross to become obscured at each temperature (1 mark)
Keep all other variables constant: concentrations, volumes, and positioning of flask and cross (1 mark)
Rate should be compared using 1 ÷ time for disappearance to give values proportional to rate (1 mark)
Multiple repeats at each temperature should be taken and averaged to improve reliability (1 mark)
Accept any valid, clearly explained alternatives.
FAQ
The key is to identify a physical property that changes clearly and measurably as the reaction proceeds.
Choose a method based on:
Whether a gas is produced
Whether a visible change occurs
How fast the reaction is expected to take place
Slow reactions suit continuous measurements (mass or volume), while rapid or visually distinctive reactions may suit time-based endpoints.
Temperature directly affects particle kinetic energy, so even small fluctuations can significantly change reaction rate.
For comparable data, all measurements must be taken at a constant temperature using:
A thermostated water bath
Pre-equilibrated reactants
Insulated apparatus where necessary
Failing to control temperature introduces systematic error, making trends unreliable.
Sampling should reflect how quickly the reaction rate changes.
In fast reactions, readings must be taken every few seconds to capture steep early gradients.
In slower reactions, less frequent sampling prevents unnecessary disturbance without losing detail.
The aim is to generate a smooth curve that shows both the initial rate and later slowing stages.
Random error arises mainly from subjective judgement.
It can be reduced by:
Using the same observer for all trials
Keeping the reaction vessel at a fixed height and angle
Ensuring consistent lighting
Averaging multiple repeat times
These steps improve reproducibility even though the endpoint remains qualitative.
Any leak causes underestimation of gas volume, reducing accuracy.
Loose tubing, poorly fitted bungs, or cracked syringes allow gas to escape unnoticed.
Before data collection, students should:
Test airtightness by gently applying pressure and checking for movement
Ensure tubing fits securely
Replace worn or stiff syringe plungers
Good sealing ensures that all generated gas is measured and rate values remain valid.
