
OCR Specification focus:
‘Use length, cross-section, and resistance measurements to determine a metal’s resistivity.’
Measuring metal resistivity involves determining how strongly a material opposes the flow of electric current. This experiment links resistance, dimensions, and material properties for accurate physical characterisation.
Understanding Resistivity
What is Resistivity?
Resistivity is a fundamental property describing how a material resists the movement of charge carriers.
Resistivity (ρ): The intrinsic property of a material that quantifies how strongly it opposes the flow of electric current. It depends on the material type and temperature, not the shape or size.
Resistivity provides valuable insight into material behaviour, helping physicists and engineers select suitable conductors for circuits, transmission lines, and components.
The Relationship Between Resistance and Resistivity
EQUATION
—-----------------------------------------------------------------
Resistivity Equation (R = ρL/A)
R = Resistance (ohms, Ω)
ρ = Resistivity (ohm metres, Ω m)
L = Length of conductor (metres, m)
A = Cross-sectional area (square metres, m²)
—-----------------------------------------------------------------
This equation shows that resistance is directly proportional to length (L) and inversely proportional to cross-sectional area (A) for a material with constant resistivity (ρ). Therefore, doubling the length doubles the resistance, while doubling the area halves it.
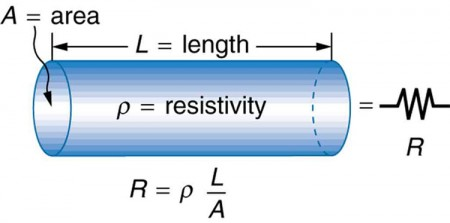
Uniform cylindrical conductor showing how resistance depends on its length (L) and cross-sectional area (A). This directly visualises the relationship R = ρL/A described in the notes. The hosting page includes extra temperature context not required by the syllabus, but the figure itself is strictly relevant. Source.
Experimental Aim and Principle
The aim of the measuring metal resistivity experiment is to determine a metal wire’s resistivity using measurable quantities. This requires:
Measuring the resistance (R) of the wire for known lengths.
Measuring its length (L) precisely.
Determining its cross-sectional area (A) from diameter readings.
By combining these measurements and applying the equation R=ρL/AR = ρL/AR=ρL/A, one can solve for ρ.
Apparatus and Setup
Essential Equipment
Metal wire sample (commonly nichrome or constantan for stable properties).
Metre ruler or micrometer screw gauge for accurate length and diameter measurement.
Ohmmeter or digital multimeter to measure resistance.
Power supply, switch, voltmeter, and ammeter if using a circuit-based method.
Connecting leads and crocodile clips.
Diagram Representation
Students should draw a clear circuit diagram using standard OCR circuit symbols, showing the arrangement of wire, meter connections, and power source. The diagram must clearly indicate:
The segment of wire under test.
Points of connection for voltage and current measurement.
The power control or variable resistor to adjust current safely.
Measurement Procedure
Step-by-Step Process
Set up the circuit
Connect the wire in series with a power supply and an ammeter.
Place a voltmeter across the section of wire being tested.
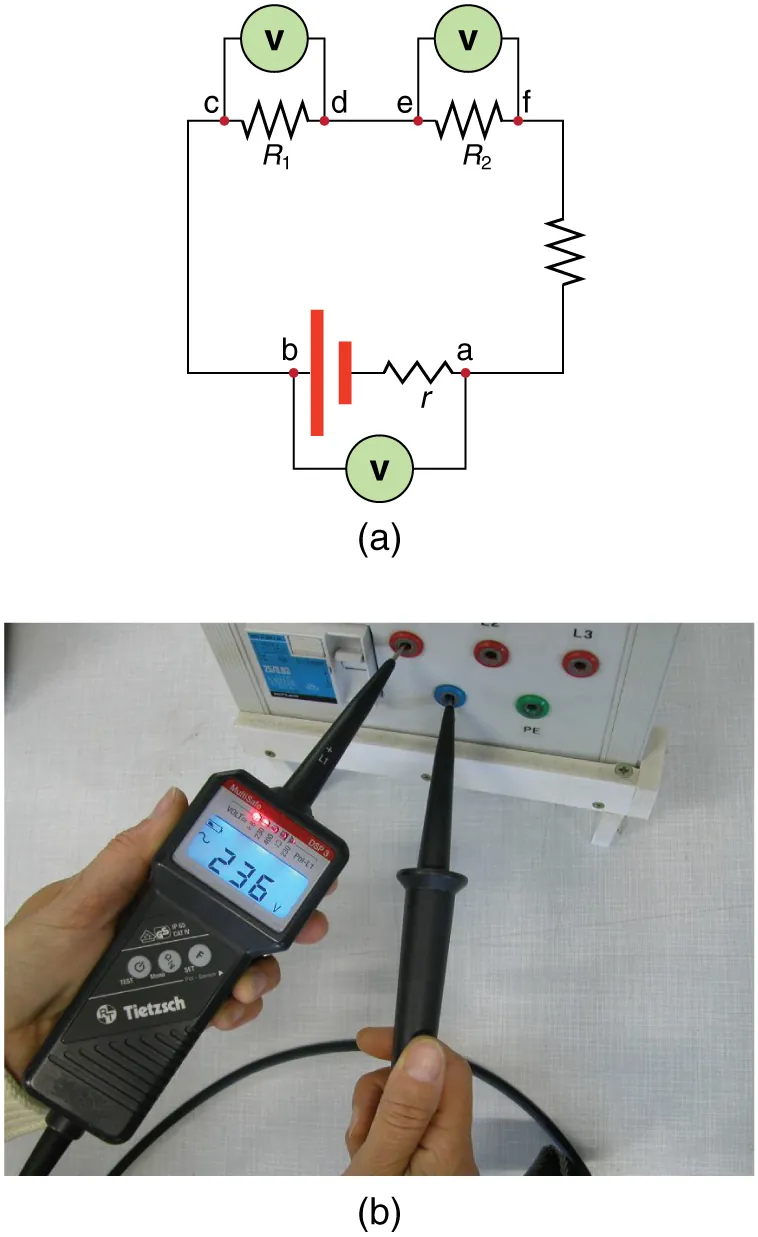
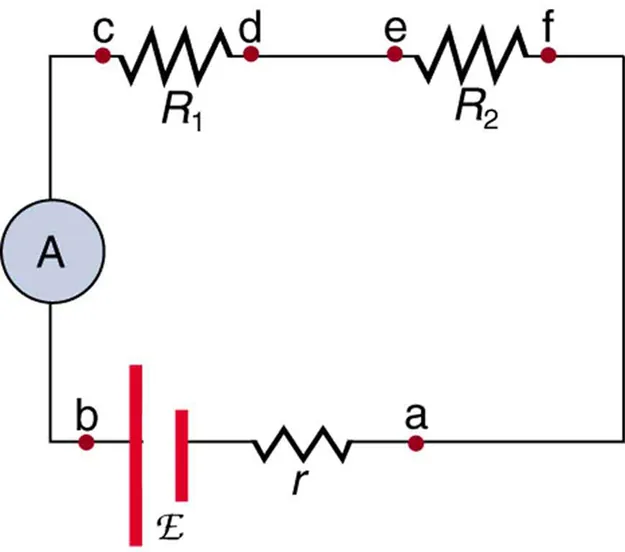
Voltmeter connected in parallel and ammeter in series for measuring potential difference and current without significantly altering circuit behaviour. This corresponds to the voltmeter–ammeter method used to obtain R = V/I. The figures include an internal source resistance and two resistors beyond the OCR requirement. Source.
Include a switch and variable resistor for control and safety.
Measure the wire’s diameter
Use a micrometer to take multiple readings along the wire.
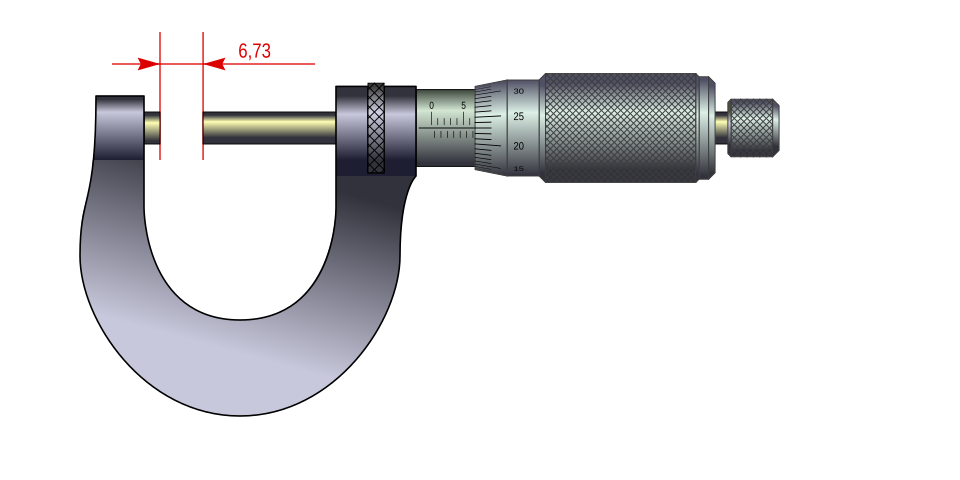
External micrometer screw gauge used to measure a wire’s diameter precisely, enabling accurate calculation of cross-sectional area. The thimble and sleeve scales provide sub-millimetre resolution, reducing uncertainty in A. The image focuses on the gauge’s mechanics and excludes the wire itself. Source.
Take measurements at several positions and orientations to account for irregularities.
Calculate the mean diameter (d) and find the cross-sectional area using
A=πd2/4A = πd² / 4A=πd2/4.
Record resistance data
Measure the potential difference (V) across and current (I) through the wire for each selected length.
Determine resistance using R=V/IR = V/IR=V/I.
Ensure current is low to avoid heating effects that could alter resistance.
Vary the length
Change the length of the wire between connection points, keeping other conditions constant.
Record R for several lengths (e.g. 0.10 m to 1.00 m).
Plot and analyse data
Plot R against L on a graph.
The gradient of the straight-line graph equals ρ/Aρ/Aρ/A.
Multiply the gradient by A to determine resistivity (ρ).
Accuracy and Error Reduction
Minimising Experimental Uncertainty
High-quality measurements are essential for valid results. Students should:
Use tight, clean connections to reduce contact resistance.
Keep the current low to minimise heating and prevent temperature-related resistivity changes.
Ensure measurement precision:
Use a ruler with 1 mm precision for L.
Use a micrometer with ±0.01 mm precision for d.
Take multiple readings and calculate averages for each quantity.
Avoid stretching or damaging the wire, as this alters both L and A.
Systematic and Random Errors
Systematic errors can arise from zero errors in instruments or constant heating of the wire.
Random errors originate from human reading uncertainty and small fluctuations in current or voltage.
Recording repeated values and calculating the mean helps reduce the influence of random errors.
Data Analysis and Calculation
Once the experimental data is collected:
Use graphical analysis to find the gradient accurately.
The straight-line relationship between R and L confirms that the wire follows Ohm’s law and that the material behaves ohmically under experimental conditions.
Calculate resistivity using
ρ=gradient×Aρ = \text{gradient} × Aρ=gradient×A.Compare the obtained value with published data for the same metal to evaluate accuracy.
Evaluating Results
Key Considerations
If resistivity is higher than expected, possible causes include poor contact points, thin sections in the wire, or incorrect diameter readings.
If non-linearity appears on the R–L graph, the wire may be heating up, altering its resistivity with temperature.
For valid results, the R–L graph should pass through the origin and display a linear relationship.
Temperature Effects
Since metal resistivity increases with temperature, even small heating can skew results. Minimising the current and limiting testing time reduces this problem. This principle links closely to later subtopics on temperature dependence.
Practical Skills and Safety
Good Laboratory Practice
Disconnect power when adjusting circuit components.
Avoid touching live wires or exposed connections.
Handle measuring tools gently to maintain calibration accuracy.
Reporting Results
Students should present data in a well-labelled table, including:
Length (m)
Voltage (V)
Current (A)
Calculated resistance (Ω)
Average diameter (m)
Cross-sectional area (m²)
Each measurement must include appropriate units and uncertainties, clearly shown in the analysis.
Applications of Metal Resistivity Measurement
Determining resistivity allows engineers to:
Select materials for wiring and electronic components based on performance and efficiency.
Diagnose material purity, since impurities increase resistivity.
Design conductors with predictable current-handling and thermal properties.
Understanding how to measure and interpret resistivity forms the foundation for exploring resistance in practical circuits, ensuring students can apply theoretical knowledge to real-world experiments.
Practice Questions
Question 1 (2 marks)
A student measures the diameter of a copper wire as 0.42 mm and its length as 1.20 m. The resistance of the wire is found to be 0.09 Ω.
Using the equation R = ρL/A, calculate the resistivity of copper. Give your answer in standard form, to two significant figures.
Mark scheme:
Correct calculation of cross-sectional area, A = πd²/4 = π(0.00042)²/4 = 1.385 × 10⁻⁷ m² (1 mark)
Correct substitution and rearrangement for ρ = RA/L = (0.09 × 1.385 × 10⁻⁷) / 1.20 = 1.0 × 10⁻⁸ Ω m (1 mark)
Question 2 (5 marks)
Describe how you would carry out an experiment to determine the resistivity of a metal wire. Include details of the apparatus, measurements, and methods used to improve accuracy.
Mark scheme:
States that resistance, R, of the wire is determined using a circuit with a power supply, ammeter in series, and voltmeter across the wire (1 mark)
Describes measuring the wire’s length using a ruler or metre rule and its diameter using a micrometer at several points (1 mark)
Explains calculating the mean diameter and cross-sectional area using A = πd²/4 (1 mark)
Mentions plotting a graph of R against L to determine resistivity from the gradient, ρ = gradient × A (1 mark)
Mentions at least one valid accuracy or safety improvement, e.g. keeping current low to prevent heating, using clean connections, or taking repeated readings (1 mark)
FAQ
Differences usually arise from experimental inaccuracies and material imperfections. Contact resistance at connections, poor temperature control, or incorrect diameter readings can distort the results.
Impurities or internal stresses in the wire can also increase resistivity compared to pure samples. Additionally, small variations in cross-sectional area along the wire may lead to an over- or underestimation of ρ.
A micrometer screw gauge offers higher precision, typically ±0.01 mm, compared to ±0.1 mm for a vernier caliper.
Since the wire’s cross-sectional area depends on the square of the diameter, even a small measurement error in d produces a large percentage error in A. Using a micrometer and averaging several readings minimises this uncertainty and increases the reliability of the calculated resistivity.
As temperature rises, the metal’s atomic vibrations increase, causing greater electron scattering and therefore higher resistivity.
If the wire heats during current flow, its resistance will increase, producing a falsely high value for ρ.
To control this, students should:
Use a low current and short measurement intervals.
Allow the wire to cool between readings.
Record ambient temperature for consistency.
The relationship R = ρL/A predicts that resistance is directly proportional to length. A zero-length wire would ideally have zero resistance, so the line should pass through the origin.
A graph not passing through the origin suggests systematic errors, such as:
Additional resistance from connecting leads or contact points.
A zero error in measurement instruments.
Correcting or accounting for these ensures a valid determination of resistivity.
In principle, yes—but only if the material conducts electricity and allows measurable current flow.
For non-metals or semiconductors, resistivity is often temperature-dependent and nonlinear, requiring different measurement techniques.
Materials like carbon or silicon exhibit variable conductivity and may need low-voltage DC sources, sensitive current meters, or even four-point probe methods to reduce contact resistance and achieve accurate results.
