
OCR Specification focus:
‘Use signal generators and oscilloscopes—time-base and volts/division—and generate and measure waves with microphones, loudspeakers, ripple tanks, or transducers.’
Signal generators and oscilloscopes are essential tools for studying and visualising waves in physics. They enable accurate measurement, generation, and analysis of waveforms in experimental investigations.
Signals and Their Characteristics
Signals represent variations of a physical quantity with time, often used to convey information or describe wave motion. They can be analogue or digital, but in this subtopic, the focus is on analogue signals and their investigation using laboratory equipment.
Analogue signals vary continuously with time and amplitude, allowing detailed observation of wave properties such as frequency, amplitude, and phase.
Periodic Signals
A periodic signal repeats at regular time intervals and is defined by its period (T) and frequency (f).
EQUATION
—-----------------------------------------------------------------
Frequency (f) = 1 / Period (T)
f = frequency (hertz, Hz)
T = period (seconds, s)
—-----------------------------------------------------------------
Understanding these relationships allows students to measure and interpret oscillations seen on an oscilloscope screen.
The Signal Generator
A signal generator is an electronic device that produces controlled waveforms for experimental purposes. These waveforms may include sine, square, or triangular waves.
Key functions of a signal generator include:
Producing waveforms of specific frequencies and amplitudes.
Providing a known input to a circuit or experimental setup.
Allowing comparison between theoretical and observed results.
In wave investigations, signal generators are used to create electrical oscillations that can be converted into sound or mechanical vibrations using loudspeakers, transducers, or vibration generators.
Output Parameters
Students must understand how to control and interpret the following adjustable parameters:
Frequency control – determines how many oscillations occur per second.
Amplitude control – adjusts the maximum voltage output of the waveform.
Waveform selector – allows switching between sine, square, or triangular waves.
The Cathode Ray Oscilloscope (CRO)
An oscilloscope is an instrument that displays how voltage varies with time. The cathode ray oscilloscope (CRO) provides a visual representation of an electrical signal on a screen, enabling measurement of amplitude, period, and frequency.
Cathode Ray Oscilloscope (CRO): A device that uses an electron beam to display an electrical signal’s variation with time on a phosphorescent screen.
The horizontal axis represents time (controlled by the time-base setting), and the vertical axis represents voltage (controlled by the volts/division setting).
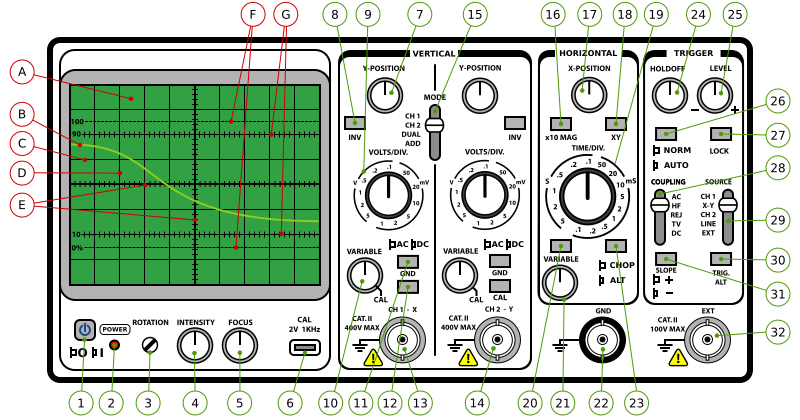
Front panel of a CRT oscilloscope showing the main controls, including time-base and volts/division knobs. The diagram highlights how each axis is controlled for accurate measurement. Source.
Main Controls of an Oscilloscope
To use an oscilloscope effectively, it is essential to understand its main control settings:
Time-base control – sets the horizontal scaling, determining how much time is represented per division.
Volts/division control – sets the vertical scaling, determining how much voltage is represented per division.
Trigger control – stabilises the waveform on the screen by ensuring it starts at the same point each time.
Y-gain – adjusts the sensitivity of the vertical deflection.
By adjusting these controls, users can produce a stable, measurable waveform.
Measuring Wave Properties Using an Oscilloscope
When a signal generator output is connected to an oscilloscope, students can measure key wave properties directly.
To measure the amplitude:
Count the number of vertical divisions from the centre line to the peak of the waveform.
Multiply by the volts/division setting to find the peak voltage.
To measure the period and frequency:
Count the number of horizontal divisions for one complete cycle.
Multiply by the time-base setting to find the period (T).
Calculate the frequency (f) using f = 1 / T.
These measurements are essential for verifying theoretical relationships in wave and electrical experiments.
Investigating Waves Using Experimental Apparatus
Using Loudspeakers and Microphones
Sound waves can be investigated by converting electrical signals to sound using a loudspeaker and detecting them with a microphone.
The loudspeaker acts as a transducer, converting electrical energy into mechanical vibrations.
The microphone converts sound waves back into electrical signals.
By displaying both input and output signals on a dual-trace oscilloscope, phase differences and time delays can be measured.
Transducer: A device that converts one form of energy into another, commonly electrical to mechanical or vice versa.
This setup is useful for exploring phenomena such as phase differences, resonance, and interference patterns.
Using a Ripple Tank
A ripple tank provides a visual model of wave behaviour in two dimensions. It is used to investigate reflection, refraction, and interference.
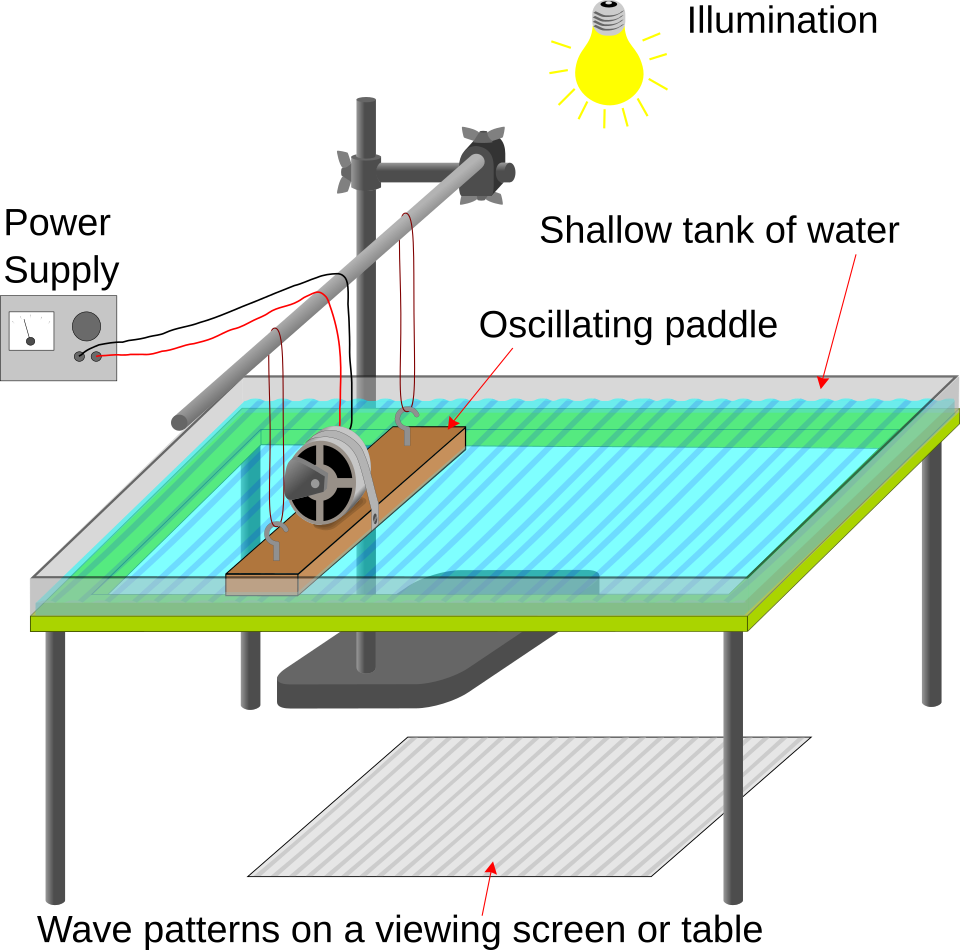
Illustration of a ripple tank with a light source, vibrating paddle, shallow water tray, and screen. The setup demonstrates key wave properties such as reflection and interference. Source.
Key components of a ripple tank setup:
Wave generator: Often a vibrating bar or paddle powered by a signal generator.
Tank of water: The medium through which waves propagate.
Light source and screen: Used to project the moving wave pattern onto a viewing surface.
The frequency of the signal generator determines the wave frequency, while the amplitude setting controls the wave height.
Oscilloscopes in Waveform Analysis
Oscilloscopes can compare phase relationships between two signals using dual trace mode, where both signals are displayed simultaneously.
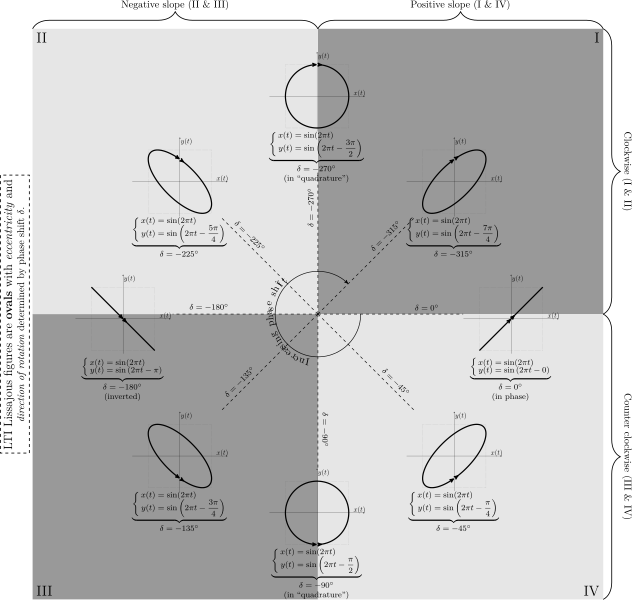
Lissajous figures showing phase relationships between two sinusoidal signals of equal frequency. The changing shapes correspond to different phase differences, visualised using an oscilloscope in XY mode. Source.
This is particularly useful for analysing alternating current (AC) circuits and resonance.
Key uses in waveform analysis:
Determining the phase difference between voltage and current.
Identifying distortions in waveforms due to circuit components.
Measuring time delays and synchronisation in electronic systems.
EQUATION
—-----------------------------------------------------------------
Phase Difference (ϕ) = (Time Difference / Period) × 360°
ϕ = phase difference (degrees)
Time Difference = delay between two corresponding points on waveforms (s)
Period = time for one full cycle (s)
—-----------------------------------------------------------------
By interpreting such results, students develop practical understanding of wave superposition, resonance, and energy transfer.
Safety and Best Practice
When handling oscilloscopes, signal generators, and associated apparatus:
Ensure all electrical connections are secure before switching on.
Avoid exceeding the voltage rating of the input terminals.
Use low-voltage outputs from signal generators for sound or water experiments.
Maintain dry hands and surfaces when working near electrical devices and ripple tanks.
Good practice includes recording instrument settings, noting environmental conditions, and repeating measurements to confirm consistency.
Practice Questions
Question 1 (2 marks)
An oscilloscope is connected to a signal generator producing a sine wave. The time-base is set to 2.0 ms per division, and one complete cycle of the waveform occupies 4 divisions on the screen.
Calculate the frequency of the signal displayed.
Mark Scheme:
Correctly calculates the time period:
T = 4 × 2.0 ms = 8.0 ms (1 mark)Calculates frequency using f = 1/T = 1 / (8.0 × 10⁻³) = 125 Hz (1 mark)
Question 2 (5 marks)
Describe how you would use a signal generator, loudspeaker, microphone, and oscilloscope to measure the speed of sound in air. Include details of the apparatus arrangement, measurements taken, and how the data are used to determine the speed.
Mark Scheme:
Apparatus setup described:
Signal generator connected to loudspeaker to produce a steady sound wave of known frequency (1 mark).
Microphone connected to oscilloscope to detect the sound (1 mark).Measurement of wavelength:
Move the microphone away from the loudspeaker and note positions where the waveform on the oscilloscope repeats in phase (trough to trough or peak to peak alignment) (1 mark).
Measure the distance between consecutive positions to find the wavelength λ (1 mark).Calculation of wave speed:
Use the relationship v = f × λ, where f is the frequency from the signal generator and λ is the measured wavelength (1 mark).
FAQ
The time-base circuit controls how quickly the electron beam moves horizontally across the screen. It produces a sawtooth waveform that deflects the beam at a constant speed, allowing the oscilloscope to display voltage as a function of time.
If the time-base speed is too fast, the waveform appears compressed; if it’s too slow, the trace stretches and becomes difficult to interpret. Correct adjustment ensures that one or more full cycles of the waveform are clearly visible for measurement.
When two waveforms are displayed on a dual-trace oscilloscope, the phase difference is determined by comparing their relative horizontal positions.
Measure the horizontal displacement (Δt) between identical points on each waveform (e.g., peaks).
Measure the period (T) of one complete cycle.
Calculate phase difference using ϕ = (Δt / T) × 360°.
This method is particularly useful for comparing current and voltage in AC circuits to identify whether a component is inductive or capacitive.
Lissajous figures are patterns formed on an oscilloscope when two sinusoidal signals are applied to the X and Y inputs simultaneously.
The shape of the figure depends on the frequency ratio and phase difference between the signals.
Equal frequencies create stable, recognisable shapes such as circles or ellipses.
Frequency ratios like 2:1 or 3:2 produce looping patterns.
They are used to determine unknown frequencies or phase differences when one signal’s characteristics are already known.
Sine waves are smooth, single-frequency signals that represent the simplest form of periodic motion. Because they contain no harmonics or distortions, they provide a consistent reference for testing the performance of equipment such as amplifiers, loudspeakers, and oscilloscopes.
Using sine waves ensures that any observed distortion originates from the device under test, not from the input signal. This makes them ideal for accurate calibration and waveform analysis.
Although ripple tanks provide a clear visual model of two-dimensional wave motion, they have practical limitations:
Water depth variations can affect wave speed and clarity.
Reflection from tank edges can create unwanted interference.
Measuring wavelengths accurately is challenging if the lighting or projection angle is poor.
To minimise these effects, experiments often use shallow, uniform water depth and non-reflective barriers to absorb waves at the tank boundaries.
