
OCR Specification focus:
‘Investigate light with lasers or sources for interference and diffraction; use ICT, modelling, or data loggers and sensors; use ionising radiation with appropriate detectors.’
Light, ICT/Data Logging, and Ionising Radiation are essential components of modern experimental physics, linking classical optics with digital measurement systems and radiation detection technologies used across research and applied science.
Investigating Light: Interference and Diffraction
Light exhibits wave-like behaviour, demonstrated through interference and diffraction phenomena. These effects provide crucial evidence for the wave nature of light.
Interference
When two or more coherent light waves overlap, they produce interference patterns of alternating bright and dark fringes. Coherence ensures a constant phase difference between the waves.
Interference: The superposition of two or more coherent light waves resulting in a pattern of constructive and destructive reinforcement.
To observe interference:
Use coherent sources, typically derived from a single laser beam split into two paths (as in the Young’s double-slit experiment).
Measure fringe spacing (Δx) to determine wavelength, given by the relationship:
EQUATION
—-----------------------------------------------------------------
Fringe Spacing (Δx) = (λ × D) / s
λ = Wavelength of light (m)
D = Distance from slits to screen (m)
s = Slit separation (m)
—-----------------------------------------------------------------
Interference experiments are sensitive to environmental vibrations, air currents, and source instability, all of which can disturb the pattern. Therefore, maintaining alignment and stable light output is critical.
Diffraction
Diffraction occurs when light passes through a narrow aperture or around an obstacle, spreading out rather than travelling in a straight line. The amount of spreading depends on the ratio of wavelength to aperture size.
Diffraction: The bending and spreading of waves when they encounter an obstacle or aperture, most noticeable when wavelength is comparable to the obstacle’s size.
When using a laser, a diffraction grating produces sharp, measurable maxima suitable for determining wavelength precisely.
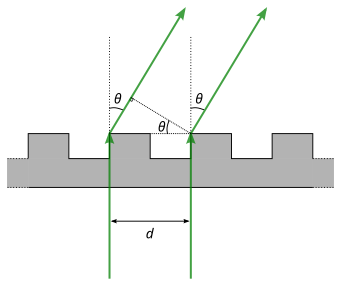
Diagram of transmission diffraction by a grating, indicating the groove spacing (d) and diffraction angle (θ) for constructive interference in order n. This visual anchors the grating equation nλ = d sinθ used to measure optical wavelengths. The figure is intentionally simple to highlight variables required by the specification. Source.
The angles of these maxima obey:
EQUATION
—-----------------------------------------------------------------
Diffraction Grating Equation: nλ = d sinθ
n = Order of maximum (integer)
λ = Wavelength of light (m)
d = Grating spacing (m)
θ = Diffraction angle (degrees or radians)
—-----------------------------------------------------------------
Gratings with higher line densities improve measurement precision, enabling determination of optical wavelengths within nanometre accuracy.
ICT, Modelling, and Data Logging
Modern physics laboratories use Information and Communication Technology (ICT) to enhance data reliability, improve efficiency, and reduce human error. Data loggers, sensors, and computer modelling tools are fundamental to these processes.
Data Logging and Sensors
Data loggers automatically record values from connected sensors at pre-set intervals, ensuring consistent data collection. This reduces random errors from manual readings and allows for high-resolution data sets.
Typical sensors include:
Light sensors for recording intensity changes in interference and diffraction patterns.
Temperature sensors for monitoring environmental effects on optical apparatus.
Motion and position sensors for dynamic measurements in oscillations and timing experiments.
Voltage and current sensors for linking electrical measurements with optical detection systems.
Data Logger: An electronic device that collects and stores data from sensors over time for later analysis.
The integration of sensors enables real-time visualisation, allowing immediate interpretation of trends and anomalies. Software linked to these systems provides data processing functions such as curve fitting, derivative analysis, and statistical evaluation.
ICT and Modelling Applications
ICT extends beyond measurement to theoretical modelling and simulation. Computer models can:
Predict experimental outcomes before physical testing.
Simulate complex light interactions, including interference in multiple slits or non-ideal diffraction patterns.
Process experimental data to identify systematic deviations and refine apparatus design.
These digital approaches allow rapid iteration of experimental configurations, increasing precision and understanding of underlying physical laws.
Ionising Radiation and Detection
The study of ionising radiation requires careful handling and measurement using appropriate detection instruments. Ionising radiation interacts with matter by ejecting electrons from atoms, forming ions.
Types of Ionising Radiation
There are three principal types of ionising radiation encountered in the laboratory:
Alpha (α): Helium nuclei; highly ionising but with low penetration, stopped by paper or skin.
Beta (β): High-speed electrons or positrons; moderate ionisation and penetration, stopped by aluminium.
Gamma (γ): High-frequency electromagnetic radiation; weakly ionising but highly penetrating, requiring lead shielding.
Ionising Radiation: Radiation with sufficient energy to remove tightly bound electrons from atoms, producing charged ions.
Radiation Detectors
To meet the OCR specification, students must use ionising radiation with appropriate detectors. Common detectors include:
Geiger–Müller (GM) tube: Detects individual ionising particles through gas ionisation and pulse counting.
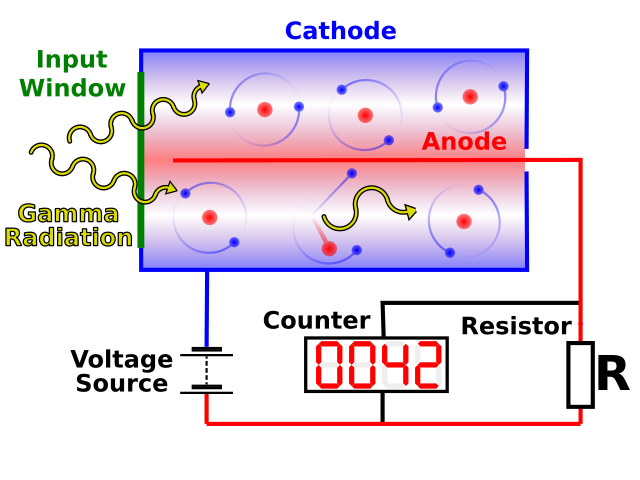
Labelled schematic of a GM tube and basic pulse-counting circuit, illustrating how ionising events create detectable electronic pulses for count rate (R = N/t) measurements. The circuit detail aids understanding of how the detector interfaces with logging electronics. Extra detail: the diagram includes a full counting circuit and input window — helpful context but not strictly required by the syllabus. Source.
Scintillation counter: Uses light emitted by a phosphor when struck by radiation, converted to an electronic signal.
Photographic film: Darkens upon exposure, traditionally used for long-term monitoring of radiation dose.
EQUATION
—-----------------------------------------------------------------
Count Rate (R) = N / t
R = Count rate (s⁻¹)
N = Number of detected events
t = Time interval (s)
—-----------------------------------------------------------------
Background radiation must always be measured and subtracted from recorded counts to obtain accurate results. Shielding, distance, and reduced exposure time are key safety principles when handling radioactive materials.
Safety and Risk Management
Experiments involving ionising radiation demand strict adherence to radiation protection protocols:
Use sources only under supervision and store them in lead containers.
Maintain distance using handling tools such as tongs.
Minimise exposure duration and monitor cumulative dose where applicable.
ICT can also support radiation experiments by logging count data automatically, providing precise decay curves for analysis. This integration underscores the connection between traditional measurement techniques and digital analysis tools across modern physics.
Practice Questions
Question 1 (2 marks)
A student uses a laser and a diffraction grating to determine the wavelength of light. The grating has 500 lines per millimetre, and the first-order maximum is observed at an angle of 17.5°.
(a) State the equation that relates the wavelength, the grating spacing, and the diffraction angle. (1 mark)
(b) Explain why higher-order maxima may be difficult to observe in this experiment. (1 mark)
Mark Scheme
(a) 1 mark for:
Correct equation stated: nλ = d sinθ (1 mark)
(b) 1 mark for:
Recognising that at higher orders, diffraction maxima become fainter or overlap, reducing visibility (1 mark)
Question 2 (5 marks)
A physics student investigates the activity of a weak radioactive source using a Geiger–Müller (GM) tube connected to a data logger.
(a) Describe how the GM tube detects ionising radiation and how the data logger can be used to improve the accuracy of the results. (3 marks)
(b) The student repeats the experiment at different distances from the source. Explain the safety precautions that must be followed when carrying out this investigation. (2 marks)
Mark Scheme
(a) 3 marks for:
Description that ionising radiation enters the GM tube and ionises the gas inside, producing charged particles (1 mark)
Electrons accelerate towards the anode, causing an avalanche discharge and producing a measurable pulse (1 mark)
Data logger automatically records counts at regular intervals, improving reliability and removing human timing error (1 mark)
(b) 2 marks for:
Correctly identifying safety precautions, e.g. minimise exposure time, maximise distance, and use tongs or shielding (1 mark)
Explanation that these measures reduce radiation dose and comply with standard laboratory safety procedures (1 mark)
FAQ
A laser provides monochromatic (single wavelength) and coherent light, meaning the waves maintain a constant phase difference. This coherence ensures stable, well-defined interference and diffraction patterns.
In contrast, ordinary light sources emit a range of wavelengths and incoherent waves, which cause overlapping and blurred fringes.
Using a laser also gives a narrow, intense beam, reducing background illumination and making fringe positions easier to measure accurately.
Data loggers eliminate human reaction time errors, providing more consistent measurements.
They can record data continuously over long periods, capture short-lived events, and store high-resolution datasets for later analysis.
Linked software can:
Generate real-time graphs
Perform statistical and trend analysis
Detect anomalies quickly
This automation improves both precision and reproducibility, which are critical for meeting modern experimental standards.
Common sources of inaccuracy include:
Misalignment of the laser beam and grating normal
Uncertainty in measuring the diffraction angle, particularly at higher orders
Non-uniform spacing or imperfections in the grating lines
Parallax error when reading scales or viewing fringes off-axis
To reduce these errors, ensure the grating is perpendicular to the incident beam, use a fine angular scale, and take multiple readings to calculate a mean value.
When ionising radiation enters the GM tube through its window, it ionises gas molecules inside.
The resulting electrons accelerate towards the positively charged anode, causing further ionisation — a process known as an avalanche discharge.
This generates a pulse of current, which the circuit amplifies and counts.
A quenching gas inside the tube prevents continuous discharge, ensuring each pulse corresponds to a single radiation event.
Background radiation from natural sources (cosmic rays, rocks, or building materials) adds unwanted counts to measurements.
This can be minimised by:
Measuring the background count rate before the experiment
Subtracting it from subsequent readings
Shielding materials such as lead or aluminium can block radiation depending on type:
Lead for gamma rays
Aluminium for beta particles
Paper for alpha particles
These measures ensure the recorded data represents only the intended radioactive source.
