
OCR Specification focus:
‘Use trolleys, air-tracks, light gates, data-loggers or video to investigate motion and collisions reliably.’
Investigating motion and collisions experimentally develops understanding of kinematic principles through direct observation and data analysis, using precise apparatus and methods to measure displacement, velocity, and acceleration accurately.
Apparatus for Investigating Motion
Trolleys and Linear Tracks
A trolley on a linear track provides a controlled system for studying motion under near-constant acceleration. Low-friction tracks minimise resistive forces, allowing motion to approximate ideal conditions. By adjusting the incline of the track or attaching a pulley system with hanging masses, acceleration can be varied predictably.
Key features include:
Smooth, level surfaces to reduce friction.
Adjustable inclines to control acceleration.
Masses added to trolleys to investigate momentum effects in collisions.
Air Tracks
An air track supports a glider on a cushion of air to eliminate friction almost completely. Air escapes through small holes along the track, allowing gliders to move with negligible resistance. This makes air tracks ideal for investigating uniform motion and elastic collisions.
Benefits:
Provides near-frictionless conditions.
Enables accurate measurement of constant velocity or uniform acceleration.
Allows clear analysis of momentum conservation in collisions.
Light Gates
Light gates are electronic timing devices that detect the passage of an object by interrupting a light beam. Connected to a data-logger or timer, they record precise times for velocity and acceleration calculations.
Typical uses:
Measuring instantaneous velocity as an object passes through the gate.
Determining acceleration by timing intervals between two or more gates.
Recording data automatically to eliminate reaction time errors.
Data-Loggers
Data-loggers are digital systems that record and process data from sensors or light gates in real time.
Advantages:
Provide high temporal resolution and accuracy.
Reduce human error compared to manual timing.
Enable instant display and analysis of motion graphs.
Video Analysis
Video analysis software allows frame-by-frame examination of motion. A scale is set using a known reference length, and the object’s position is tracked across frames to calculate displacement, velocity, and acceleration.
Applications:
Analysing complex or two-dimensional motion.
Reviewing motion too fast or subtle for manual measurement.
Investigating collisions and rebounds with detailed frame data.
Use trolleys, air-tracks, light gates, data-loggers or video to investigate motion and collisions reliably.
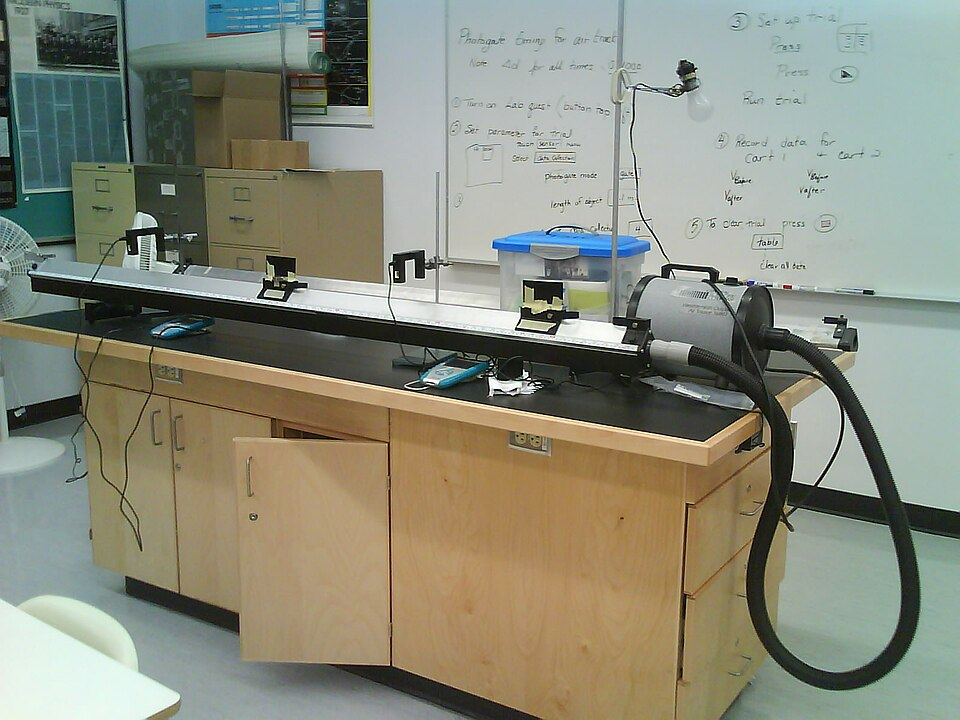
Linear air track with a glider, blower and photogates arranged along the rail. The blower reduces friction so timing at each gate gives accurate velocity and acceleration data. This arrangement is suitable for both single-body motion and collision studies. Source.
Methods for Investigating Motion
Recording Linear Motion
To study motion with uniform or varying acceleration, students use trolleys or air-track gliders and measure distances and times between defined points.
General method:
Mark equal intervals along the track.
Use light gates or motion sensors to record times at each point.
Calculate velocity and acceleration from recorded data.
Instantaneous velocity: The velocity of an object at a specific instant in time, determined from very short measurement intervals.
Data are often plotted on displacement–time or velocity–time graphs for interpretation. Gradients and areas under these graphs reveal motion relationships between quantities.
Investigating Collisions
When two trolleys or gliders collide, the experiment explores conservation of momentum and types of collision.
Elastic collision: A collision in which total kinetic energy and momentum are both conserved.
Inelastic collision: A collision in which momentum is conserved, but some kinetic energy is transformed into other forms, such as sound or heat.
Typical steps:
Set two gliders or trolleys moving towards each other at measured speeds.
Use light gates or video tracking to record velocities before and after collision.
Compare total momentum before and after to verify conservation laws.
EQUATION
—-----------------------------------------------------------------
Conservation of Momentum: m₁u₁ + m₂u₂ = m₁v₁ + m₂v₂
m₁, m₂ = Masses of the two objects (kg)
u₁, u₂ = Initial velocities (m s⁻¹)
v₁, v₂ = Final velocities (m s⁻¹)
—-----------------------------------------------------------------
In practice, small losses of kinetic energy indicate partially inelastic collisions due to friction and deformation.
Ensuring Reliable and Accurate Data
Reliability depends on the consistency and accuracy of measurements. Experimental design should minimise error sources and allow repeatable results.
Key reliability considerations:
Use low-friction or air-supported motion systems.
Ensure light gates are aligned at consistent heights.
Calibrate timing devices and verify measurement precision.
Repeat trials and calculate mean values.
Systematic error: A consistent deviation in measurement due to faulty equipment or bias, affecting accuracy.
Random error: Unpredictable fluctuations in measured values due to uncontrollable variables or human limitations.
Mitigating systematic and random errors strengthens experimental validity. Using automated systems like data-loggers further improves measurement reliability.
Use data-loggers or video to capture and analyse motion data.
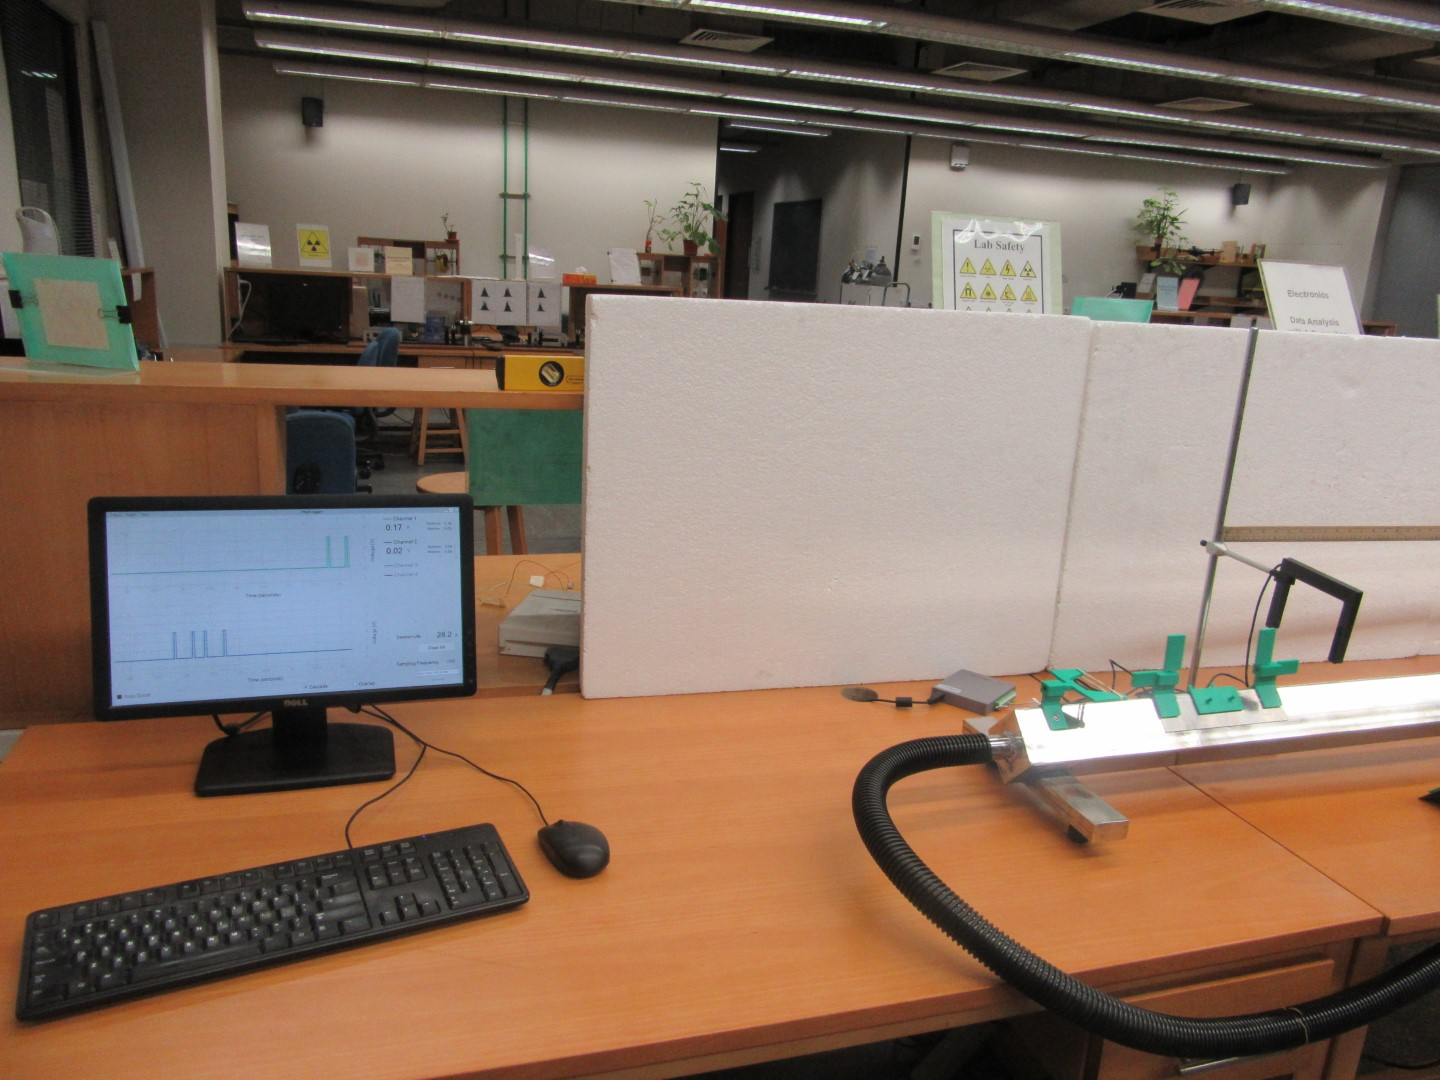
Photogates mounted on a linear air track and connected to a PC interface (Physlogger). The system records gate interruptions to compute velocity and acceleration with minimal user timing error. The visible software display emphasises automated, high-frequency data capture. Source.
Analysing and Interpreting Motion Data
Graphical Analysis
Recorded data are used to construct motion graphs to visualise relationships between physical quantities.
For example:
Displacement–time graph: Gradient equals velocity.
Velocity–time graph: Gradient equals acceleration; area under curve equals displacement.
From these graphs, key parameters such as maximum velocity or average acceleration can be derived and compared across different trials.
EQUATION
—-----------------------------------------------------------------
Average Acceleration (a) = (v – u) / t
a = Acceleration (m s⁻²)
v = Final velocity (m s⁻¹)
u = Initial velocity (m s⁻¹)
t = Time taken (s)
—-----------------------------------------------------------------
Using ICT in Data Processing
Modern investigations often incorporate software for automated plotting, regression analysis, and error estimation.
ICT tools enable:
Instant creation of velocity–time and acceleration–time graphs.
Curve fitting for non-linear motion data.
Quantitative comparison between experimental and theoretical values.
The integration of digital methods promotes deeper conceptual understanding by linking theoretical motion models to real experimental evidence.
Practical Skill Development
Investigating motion and collisions cultivates essential experimental and analytical skills required in advanced physics. Students learn to:
Design valid and reproducible experiments.
Handle measurement devices confidently and safely.
Interpret data critically using mathematical reasoning.
Through such investigations, learners connect theoretical kinematics to observable reality, reinforcing the precision and investigative rigour expected in A-Level Physics.
Practice Questions
Question 1 (2 marks)
A student uses a light gate and data-logger to measure the velocity of a glider moving along a frictionless air track.
Explain why using this apparatus gives a more accurate measurement of velocity than using a stopwatch and ruler.
Mark Scheme:
1 mark: States that the light gate records the exact time the glider interrupts the beam, removing human reaction time error.
1 mark: States that the data-logger provides precise timing and automatic calculation of velocity from the measured time interval and distance.
Question 2 (5 marks)
A physics student investigates collisions using two trolleys on a low-friction track. Each trolley has a light gate and flag attached. The student records their velocities before and after collision using a data-logger.
Describe how the student could use this equipment to test the principle of conservation of momentum. Include in your answer:
what quantities need to be measured
how they are measured
how the results can be used to test conservation of momentum
Mark Scheme:
1 mark: States that masses of both trolleys are measured (using a balance).
1 mark: States that velocities before and after collision are measured using light gates connected to the data-logger (the time taken for the flag to pass through the beam gives velocity).
1 mark: Describes calculating momentum before and momentum after collision using p = mv for each trolley.
1 mark: Explains that total momentum before and after are compared to check for equality.
1 mark: States that if total momentum before equals total momentum after (within experimental error), then the principle of conservation of momentum is verified.
FAQ
An air track reduces friction by releasing a thin layer of air through tiny holes along its surface. This air cushion lifts the glider slightly, preventing direct contact with the track.
This is important because it allows objects to move under nearly ideal conditions, where resistive forces are negligible. As a result, measured accelerations or velocities more accurately reflect theoretical predictions based on Newton’s laws, without interference from frictional losses.
Several sources of error can affect the accuracy of light gate data:
Misalignment of the light beam and flag can lead to incorrect timing.
Irregularly shaped flags or inconsistent flag lengths alter the time the beam is broken.
Vibrations or unstable track surfaces cause variable motion.
Electronic delays or incorrect data-logger calibration can distort readings.
Careful alignment, repeated measurements, and calibration help minimise these effects.
Data-loggers provide automated, high-frequency measurements that eliminate human reaction time errors.
They can record velocity changes between multiple light gates or at short time intervals, allowing acceleration to be calculated accurately even when the time frame is too short for manual methods.
Additionally, data-loggers produce digital records, making it easier to generate motion graphs, identify anomalies, and apply statistical analysis for greater reliability.
Although low risk, experiments with trolleys and air tracks require attention to safety:
Ensure the track or ramp is securely clamped and level.
Keep clear of the moving trolley’s path to avoid minor impacts.
Manage power leads from blowers or data-loggers to prevent tripping.
Avoid excessive masses that could cause trolleys to move unexpectedly fast.
Following standard laboratory safety procedures ensures both accuracy and safe experimental practice.
Video analysis allows observation of motion from a different perspective and provides additional information not easily obtained from light gates.
For example:
It can track motion in two dimensions, such as during angled or rebounding collisions.
Frame-by-frame playback reveals fine timing or displacement details.
It provides visual confirmation of the motion pattern, validating sensor data.
Combining video and digital measurements offers a comprehensive view of motion, improving experimental accuracy and interpretation.
