
AP Syllabus focus:
‘Interpret derivatives of polynomial models as instantaneous rates of change, using unit analysis and graphs to describe how quantities change at particular input values.’
Polynomial derivatives offer a powerful way to analyze how modeled quantities change at specific input values, linking algebraic structure to meaningful, real-world interpretations across diverse contexts.
Interpreting Polynomial Derivatives in Context
When a situation is modeled by a polynomial function, its derivative provides immediate insight into how the represented quantity is changing at any chosen input value. Because polynomial functions are smooth and differentiable on their entire domains, their derivatives are defined everywhere, ensuring consistent interpretation of instantaneous change.
Understanding the Role of the Derivative in Context
The derivative describes the instantaneous rate of change, meaning how fast an output quantity is increasing or decreasing at a specific value of the input variable. For polynomial models, this rate can be interpreted using units from the problem’s context.
Instantaneous Rate of Change: The value of the derivative at a point, representing how quickly a function’s output is changing with respect to its input at that exact point.
A derivative value must always be read with units to ensure contextual accuracy. For example, if a polynomial models position in meters as a function of time in seconds, the derivative represents velocity measured in meters per second. The same reasoning extends to population, revenue, temperature, or any modeled quantity.
Connecting Polynomial Structure to Change
Polynomial functions vary in complexity, but their derivatives follow predictable rules. Higher-degree polynomials can produce rich behavior, such as changing concavity or multiple turning points, each affecting interpretation of the derivative.
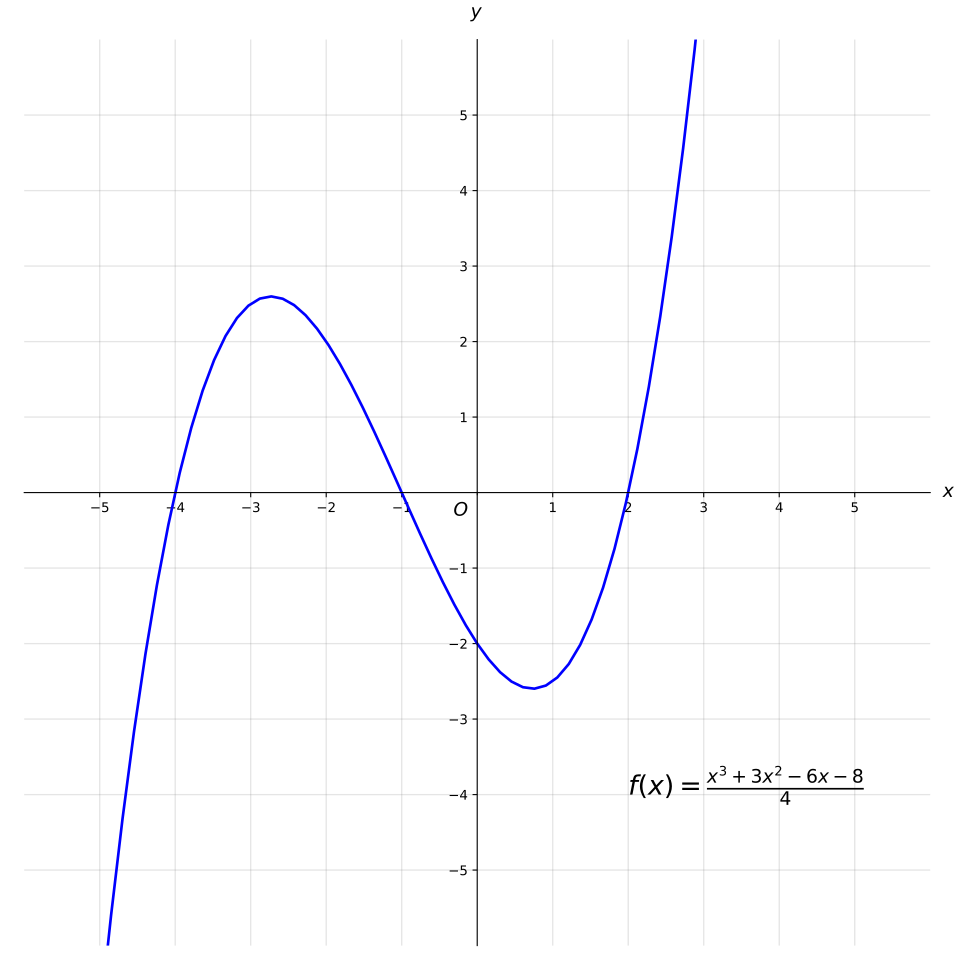
This graph displays a cubic polynomial with distinct turning points, illustrating where the derivative becomes zero and how sign changes in correspond to intervals of increase and decrease. Source.
Key ideas students should track when interpreting derivatives in context include:
Sign of the derivative:
A positive derivative indicates the modeled quantity is increasing.
A negative derivative indicates the modeled quantity is decreasing.
Magnitude of the derivative:
Larger values imply faster change, while small values indicate slow change.
Zeros of the derivative:
Points where the derivative equals zero correspond to horizontal tangents on the graph of the polynomial model.
Tangent Lines as Instantaneous Change Indicators
Viewing the derivative geometrically helps reinforce interpretation.
= Instantaneous rate of change of the polynomial at (units depend on context)
This geometric lens connects symbolic differentiation to real-world behavior by showing how steep or flat the graph is at specific points.
A meaningful interpretation of the tangent line uses both slope and direction. A steep upward slope signals rapid increase in the modeled quantity, while a nearly horizontal slope reflects momentary stability.
Using Graphs to Interpret Polynomial Derivatives
Graphs of polynomial functions and their derivatives offer complementary perspectives.
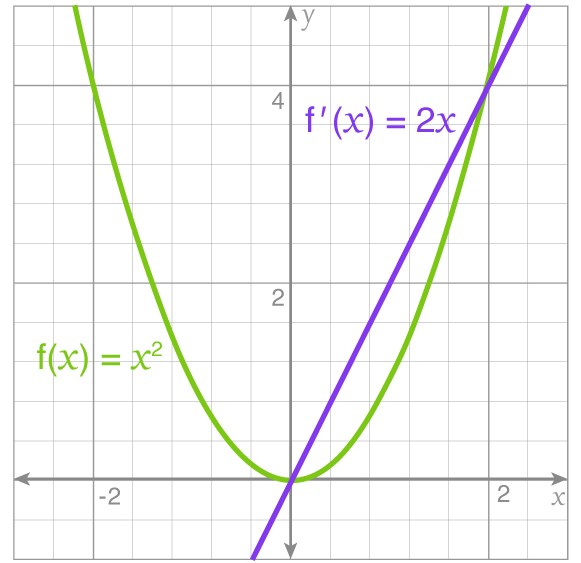
This graph compares with its derivative , highlighting how the slope of the parabola changes across its domain. The linear derivative visually represents how the rate of change increases steadily, reinforcing the connection between polynomial behavior and its derivative. Source.
When interpreting change:
Increasing sections of the graph match intervals where the derivative lies above the horizontal axis.
Decreasing sections correspond to intervals where the derivative falls below the axis.
Sharp changes in steepness reflect variations in the derivative’s magnitude.
Graphs also help identify intervals where the rate of change is accelerating or slowing, information reflected in the curvature of the polynomial model and the behavior of its derivative.
Applying Unit Analysis to Strengthen Interpretation
Unit analysis is essential when interpreting the meaning of a derivative. Without incorporating units, students risk describing change too abstractly and missing important contextual details.
Common relationships include:
If measures distance (meters), then measures meters per second.
If measures revenue (dollars), then measures dollars per unit sold.
If measures temperature (°C), then measures degrees Celsius per hour.
Interpreting derivatives with units enables students to articulate not just how a quantity changes, but how fast, in what direction, and with what significance for the modeled scenario.
Focused Strategies for Interpreting Polynomial Derivatives
Students can enhance their contextual understanding of derivatives of polynomial models by using the following strategies:
Identify the function’s units before interpreting any derivative value.
Examine the derivative’s sign to determine whether the modeled quantity is increasing or decreasing.
Assess the magnitude to judge the speed of change.
Relate the derivative to the tangent line when interpreting steepness or stability at specific inputs.
Use graphs to connect algebraic results with visual behavior and to confirm interpretations.
Describe change verbally using complete sentences that include units and reference the context explicitly.
Synthesizing Algebraic, Graphical, and Contextual Perspectives
Interpreting polynomial derivatives requires integrating symbolic differentiation with conceptual understanding of rate and graphical behavior. When these perspectives are combined, the derivative becomes a powerful tool for expressing how a polynomial model behaves at a moment in time and how quickly that behavior evolves.
Practice Questions
Question 1 (1–3 marks)
A quantity Q is modelled by the polynomial function f(x) = 3x³ − 4x² + 2x, where x represents time in hours and Q is measured in grams.
(a) State the units of f'(x). (1 mark)
(b) Interpret the meaning of f'(2) in the context of the problem. You do not need to compute its value. (2 marks)
Mark Scheme:
(a)
• 1 mark: Correct units stated as grams per hour.
(b)
• 1 mark: States that f'(2) represents the instantaneous rate of change of Q at x = 2.
• 1 mark: Interprets this rate in context, e.g., describing how quickly the quantity Q is increasing or decreasing at 2 hours.
Question 2 (4–6 marks)
A company's revenue R, measured in thousands of pounds, is modelled by the polynomial
R(x) = x³ − 6x² + 12x + 5,
where x is the number of months after a new product is launched.
(a) Explain what R'(x) represents in this context. (1 mark)
(b) The derivative is R'(x) = 3x² − 12x + 12. Determine the value of x for which the revenue is neither increasing nor decreasing. (2 marks)
(c) Using the sign of R'(x), describe the intervals where the revenue is increasing and where it is decreasing. (3 marks)
Mark Scheme:
(a)
• 1 mark: States that R'(x) represents the instantaneous rate of change of revenue with respect to time (in thousands of pounds per month).
(b)
• 1 mark: Sets R'(x) equal to zero.
• 1 mark: Correctly solves 3x² − 12x + 12 = 0 to give x = 2.
(c)
• 1 mark: States that the sign of R'(x) determines whether revenue is increasing or decreasing.
• 1 mark: Identifies that revenue is increasing for all x except at x = 2 (or equivalently, states that R'(x) is positive on both sides of x = 2).
• 1 mark: Concludes that revenue is never decreasing, since R'(x) does not take negative values.
FAQ
Practical significance depends on the scale of the units. A large derivative value may or may not matter depending on what the quantities represent.
A rate is considered meaningful when:
• It indicates a change large enough to affect the scenario being modelled.
• It reflects behaviour that stakeholders would realistically notice or act upon.
Comparing the derivative’s magnitude to typical real-world benchmarks helps determine whether the rate is small, moderate, or substantial.
Higher-degree polynomials can change direction multiple times, resulting in several intervals of increase or decrease.
Their derivatives may also vary widely in magnitude, producing:
• Rapid changes in behaviour
• More frequent or sharper turning points
• Greater sensitivity to input value changes
This complexity requires close attention to the sign and size of the derivative across the domain.
Turning points correspond to places where the derivative switches sign.
By inspecting a polynomial’s graph:
• Flattening of the curve suggests a derivative near zero.
• A noticeable change from rising to falling, or vice versa, indicates a sign change.
This qualitative approach is useful when exact algebraic computation is impractical.
Always anchor the interpretation in units and context.
Check:
• Whether the context permits negative values and what they represent.
• Whether an increasing rate means the quantity itself is growing or simply changing less negatively.
• Whether external constraints limit the interpretation, such as time intervals that are not physically meaningful.
Two derivative values may differ greatly in magnitude, but their real-world importance depends entirely on the units.
Unit analysis clarifies:
• Whether larger values truly represent faster change
• Whether comparisons are meaningful across different measurement scales
• Whether the rate describes change per item, per time, or per other input
Understanding units ensures comparisons of derivative values remain accurate and relevant to the model.
