
AP Syllabus focus:
‘Describe how productivity is measured as energy per unit area per unit time (for example, kcal/m²/year).’
Measuring productivity is about expressing biological energy capture as a rate that can be compared across ecosystems. Standard units and careful scaling help scientists interpret patterns, detect change, and communicate results consistently.
What “productivity” measurements represent
Ecological productivity is reported as a rate, not a one-time quantity. The goal is to describe how quickly energy is stored in organic matter by producers within a defined space.
Productivity: The rate at which energy is converted to biomass in a given area over a given time.
Because ecosystems differ in size and sampling duration, productivity is normalized to both area and time so results are comparable.
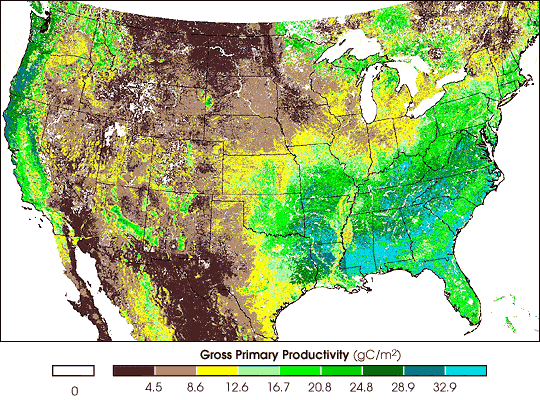
MODIS-derived gross primary production (GPP) is mapped across the United States for a defined 16‑day period, with the legend reporting values in over that time window. This is a concrete example of productivity being normalized by area (per square meter) and time (a specified interval) so different locations can be compared on the same scale. Source
Required unit structure: energy per area per time
The syllabus emphasis is that productivity is measured as energy per unit area per unit time (for example, kcal/m²/year). This format communicates three essential ideas:
Energy: how much chemical energy is stored in organic compounds
Area: where it is stored (per square meter, hectare, etc.)
Time: how fast it accumulates (per day, per year, etc.)
= productivity rate (e.g., )
= energy stored in new biomass (kcal or kJ)
= area over which productivity is measured ()
= time interval (day, month, year)
This equation expresses the meaning of the unit: if two sites have different sizes or were measured for different durations, dividing by area and time produces a fair comparison.
Common units you will see (and what they imply)
Productivity may be reported in several equivalent-looking forms, depending on what was measured directly:
Energy-based units (aligned with the syllabus wording)
kcal/m²/year, kJ/m²/year
Mass-based proxies for energy (require an assumption relating mass to stored energy)
g biomass/m²/time (often dry mass)
g C/m²/time (carbon is used because it is a major component of organic molecules)
When mass-based units are used, scientists are still expressing “energy stored,” but indirectly through biomass or carbon accumulation.
Why “per area” matters
Using per unit area controls for ecosystem size and sampling plot size:
A large forest will store more total energy than a small meadow, but may have lower productivity per m²
Comparing productivity per unit area helps identify where conditions support faster biomass/energy accumulation
Why “per time” matters
Using per unit time captures the idea that productivity is a rate:
Short intervals (day/week) can show seasonal patterns
Longer intervals (year) smooth variability and support biome-scale comparisons
Interpreting productivity values correctly
A reported value such as “kcal/m²/year” should be read as:
the rate of chemical energy storage in new plant material
standardized to a surface area and a time period
Higher values generally indicate conditions that support faster conversion of sunlight into stored chemical energy, but interpretation depends on consistent methods and units.
Practical measurement and reporting considerations (conceptual)
When reporting productivity, clarity about methods and boundaries is essential because they affect the unit’s meaning:
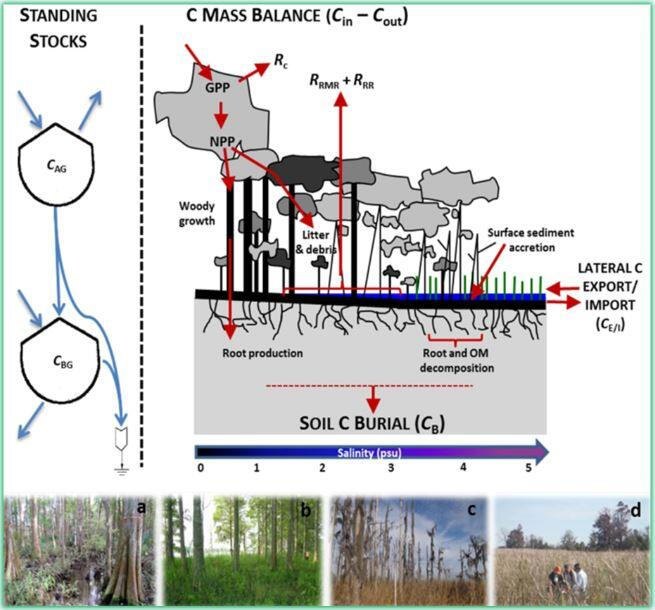
This conceptual diagram summarizes major ecosystem carbon pools and fluxes (including multiple respiration pathways), illustrating that reported productivity-related quantities depend on which processes are included inside the system boundary. It supports the idea that clear spatial boundaries and accounting choices are essential for interpreting any rate reported in per-area, per-time units. Source
Spatial boundary
ground area of a plot, a whole lake surface, or a satellite pixel
Time window
growing season vs full year (must be stated)
What is counted as “new” biomass
aboveground only vs aboveground + belowground (roots)
Even when the unit format is correct, these choices change what the number represents, so scientific communication typically specifies them alongside the units.
Practice Questions
State the standard unit structure used to report ecosystem productivity and give one example of a correctly formatted unit. (2 marks)
Mentions productivity is measured as energy per unit area per unit time (1)
Provides a correct example unit, e.g. kcal/m²/year or kJ/m²/year (1)
Explain why productivity is reported “per unit area per unit time” and describe two ways that inconsistent boundaries (area or time) could mislead comparisons between ecosystems. (5 marks)
Explains “per unit area” enables comparison across different-sized ecosystems or sample plots (1)
Explains “per unit time” expresses a rate and enables comparison across different measurement durations (1)
Misleading comparison example linked to area boundary differences (e.g. plot size, inclusion/exclusion of habitat patches) (1)
Misleading comparison example linked to time boundary differences (e.g. growing season vs full year) (1)
Clear linkage that boundary inconsistency changes what the numerical value represents, even if units look similar (1)
FAQ
kJ is the SI-aligned choice and is common in international literature.
kcal may appear in older datasets or specific textbooks; conversion consistency matters most when comparing sources.
Researchers apply an energy content factor for biomass (often based on calorimetry).
The factor depends on tissue type and water content, so metadata about assumptions is important.
Carbon-based reporting standardises comparisons across organisms with different water and mineral content.
It also aligns with carbon accounting and modelling conventions used in ecosystem science.
Satellites infer productivity from vegetation indices and light-use efficiency models.
These approaches rely on calibration with field measurements and can be biased by clouds, canopy structure, or sensor limitations.
Common sources include sampling error (plot variability), time-window choice, and conversion factors (biomass-to-energy or biomass-to-carbon).
Uncertainty may be expressed with ranges or confidence intervals alongside the unit.
