
AP Syllabus focus:
‘Time-space compression changes perceived distance through faster travel and communication, shaping spatial patterns on maps and in data.’
Technological innovations in transportation and communication reduce the perceived distance between places, reshaping how people, goods, and information move and creating new geographic patterns.
Understanding Time–Space Compression
Time–space compression refers to the decreasing significance of distance due to improvements in technology, transportation, and communication that accelerate interactions between places. As movement becomes faster and easier, the world feels “smaller,” altering how geographers interpret spatial connections.
Time–Space Compression: The process by which advancements in transportation and communication reduce the time needed to move people, goods, and ideas between places, decreasing the perceived distance.
This concept helps explain major changes in global connectivity, cultural exchange, and economic activity, and it guides geographers in analyzing emerging spatial patterns on maps and datasets.
The Role of Transportation Technologies
Transportation innovations dramatically shape how quickly movement occurs across space. Earlier forms of mobility—walking, animal transport, sailboats—imposed clear limits on distance. Modern systems compress space by making faraway places accessible within short periods.
Key Transportation Drivers of Time–Space Compression
Railroads and steamships accelerated nineteenth-century movement across continents and oceans.
Automobiles and highways provided flexible, everyday mobility across regional and national scales.
Commercial aviation made intercontinental travel routine, reducing days of travel to mere hours.
High-speed rail networks in Europe and East Asia shrink regional distances further through rapid, high-volume passenger flows.
As transportation friction declines, patterns of human settlement, tourism, migration, and trade reorganize across maps, often becoming more dense, connected, and interdependent.
Communication Technologies and Perceived Distance
While transportation shrinks physical travel time, communication technologies compress time even more dramatically by enabling instantaneous interactions.
Major Communication Forces
Telegraph and telephone networks initiated near-immediate long-distance exchange.
Satellite systems support global broadcasting and real-time navigation.
Internet and mobile technologies allow instant transfer of information, images, financial data, and social interaction worldwide.
Digital platforms link individuals, firms, and institutions across continents at virtually zero time cost.
These systems reduce the need for physical co-presence and create new, highly connected spatial patterns that geographers examine through data visualizations, network maps, and flow diagrams.
Spatial Patterns Resulting from Time–Space Compression
Time–space compression produces measurable changes in how places relate to one another. These changes appear in spatial patterns on maps, including shifts in flows, connectivity, and distribution.
Changes in Flows
Increased movement of people, such as global tourism, labor migration, and business travel.
Accelerated movement of goods through container shipping, air freight, and global supply chains.
Rapid circulation of information and culture, including media, fashions, and trends.
Flow: The movement of people, goods, ideas, or information between places across space.
These heightened flows form dense global networks that reshape regional and urban geographies.
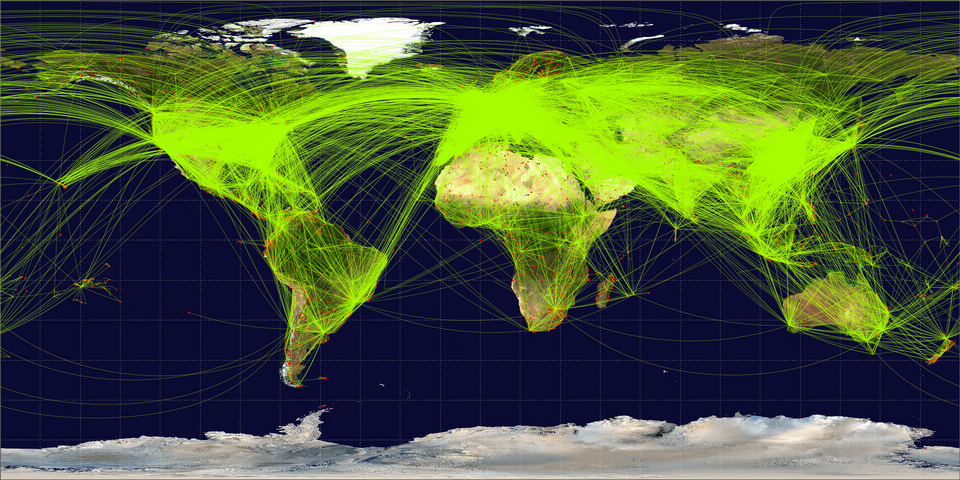
This global airline route map shows thousands of passenger flights linking major airports and regions through dense networks of air routes. Bright clusters over North America, Europe, and East Asia highlight areas of especially intense connectivity, while thinner strands show long-distance intercontinental links. The level of detail exceeds the AP requirement, but the overall pattern effectively illustrates how time–space compression produces dense flows and global hubs. Source.
After the emergence of such networks, cities often develop specialized functions, reinforcing their positions in global systems.
Shifts in Connectivity
Connectivity describes how strongly and efficiently places are linked. Time–space compression increases connectivity by enabling more frequent and rapid interactions.
Example Patterns of Increased Connectivity
Expansion of global cities that act as nodes for finance, culture, and transportation.
Growth of transportation corridors, such as airline hubs or high-speed rail lines.
Intensification of digital connectivity, where broadband and mobile networks create virtual proximity between distant locations.
As connectivity increases, peripheral regions may gain new opportunities or experience new challenges depending on their ability to integrate into broader systems.
How Time–Space Compression Shapes Patterns on Maps and in Data
Time–space compression does not occur uniformly. Some regions integrate rapidly, while others experience slower or more limited change. This uneven development appears in spatial patterns that geographers analyze at multiple scales.
Key Spatial Outcomes
Clustered economic activity near transportation hubs and communication centers.
Dispersed production networks, where manufacturing and services stretch across multiple countries.
Realignment of trade routes, often visualized through shifting maritime, road, and air pathways.
Intensified urbanization, as cities attract global capital and skilled labor.
Emergent cultural landscapes, where global and local influences interact.
These patterns reveal how changing perceived distance influences human behavior, economic decisions, and cultural exchange.
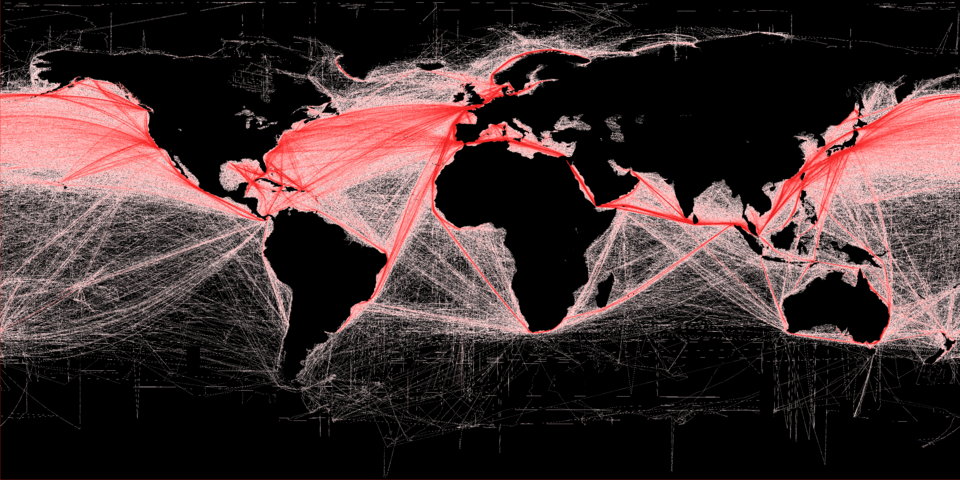
This map shows the density of commercial shipping routes worldwide, with brighter colors indicating heavier traffic along major ocean corridors. It highlights key maritime chokepoints and trade lanes that structure the global movement of goods and connect distant ports. The underlying dataset focuses on human impacts on marine ecosystems, which goes beyond the AP syllabus, but the route patterns themselves are a clear example of flows and spatial patterns shaped by time–space compression. Source.
Scale and the Interpretation of Time–Space Compression
Time–space compression has different effects depending on scale. At the global scale, it fosters worldwide networks of trade and communication. At the regional scale, it strengthens ties between cities or industrial corridors. At the local scale, new technologies reshape daily life by enabling telecommuting, online shopping, and virtual communities. Understanding scale-based variation is essential for interpreting maps and datasets that capture these patterns.
Implications for Geographic Thinking
For geographers, time–space compression provides a powerful framework for explaining why interactions intensify and why spatial patterns on maps change over time. Faster travel and communication fundamentally reshape flows, connectivity, and the spatial organization of human activity, giving rise to dynamic and interconnected geographic landscapes.
Practice Questions
Question 1 (1–3 marks)
Explain what is meant by the term time–space compression.
Mark scheme:
• 1 mark for identifying that time–space compression refers to reduced perceived distance between places.
• 1 mark for stating that this reduction is caused by advances in transportation and/or communication.
• 1 mark for noting that interactions become faster or easier as a result.
Question 2 (4–6 marks)
Using examples, analyse how time–space compression influences global spatial patterns of economic or social activity.
Mark scheme:
• 1 mark for describing how improved transport or communication increases connectivity between places.
• 1 mark for identifying that flows of people, goods, or information become faster or more frequent.
• 1 mark for explaining a resulting spatial pattern, such as the development of global hubs or clustered economic activity.
• 1 mark for providing a relevant example (e.g., airline networks, digital communication platforms, global cities).
• 1 mark for linking the example to a clear geographic outcome (e.g., increased trade routes, intensified migration, rapid cultural exchange).
• 1 mark for overall analytical clarity showing how changes in perceived distance reshape global patterns.
FAQ
Time–space compression accelerates cultural diffusion by allowing ideas, media, and behaviours to travel quickly across long distances.
Digital platforms enable near-instant sharing of cultural products, such as music, fashion, and entertainment, which can spread globally before they fully take hold locally.
It also increases interactions between distant communities, making hybrid cultural forms more common as global influences mix with regional traditions.
Access to infrastructure determines the degree of time–space compression a region experiences.
Areas with high-speed transport, widespread digital connectivity, and investment in communication networks integrate rapidly, reducing perceived distance.
Peripheral or economically disadvantaged regions may lack these systems, resulting in slower integration and more limited access to global flows.
Time–space compression enables firms to coordinate operations across multiple countries with reduced time delays.
Multinational corporations can:
• manage supply chains spread across continents
• access distant labour markets more easily
• communicate instantly with clients and partners worldwide
This leads businesses to choose locations based on cost, resources, or strategic access rather than proximity, reshaping global economic geography.
Physical geography still matters, but its constraining influence is reduced.
Mountains, oceans, and long distances once created strong barriers to interaction, but technological advances now allow people and goods to cross these features rapidly.
However, physical geography remains relevant where infrastructure is limited, where natural hazards disrupt travel or communication, or where digital access is unequal.
Regions with strong transport hubs or advanced digital connectivity benefit more from accelerated flows of capital, information, and people.
Areas without these systems struggle to keep pace, which can widen regional economic gaps.
Urban centres often experience rapid development due to increased accessibility, while remote rural areas see fewer advantages, reinforcing internal disparities.
