
AP Syllabus focus: ‘Equilibrium occurs where quantity demanded equals quantity supplied, determining the market equilibrium price.’
Market equilibrium is the central tool for analysing how prices coordinate buyers and sellers. This page explains what equilibrium means, how to identify it on a graph, and what it implies for market outcomes.
Market Equilibrium
What “equilibrium” means in a market
Market equilibrium: The price and quantity at which buyers’ planned purchases (quantity demanded) exactly equal sellers’ planned sales (quantity supplied) in a specific market.
The AP focus statement can be restated as: equilibrium occurs where quantity demanded equals quantity supplied, and that intersection determines the market equilibrium price and the equilibrium quantity.
In equilibrium, the market is market-clearing: all units that consumers want to buy at that price can be bought, and all units firms want to sell at that price can be sold.
How equilibrium is shown on a supply-and-demand graph
On the standard graph:
The vertical axis shows price.
The horizontal axis shows quantity (per time period, such as per day or per month).
The demand curve shows the quantity consumers plan to buy at each price.
The supply curve shows the quantity firms plan to sell at each price.
Equilibrium is at the intersection of the two curves:
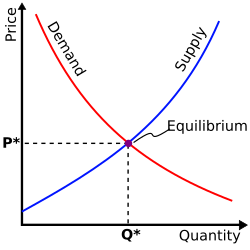
Supply and demand curves intersect at the equilibrium point, illustrating the market-clearing outcome. The diagram makes it easy to read the equilibrium price on the vertical (price) axis and the equilibrium quantity on the horizontal (quantity) axis at the point of intersection. Source
The y-coordinate of the intersection is the equilibrium price.
The x-coordinate of the intersection is the equilibrium quantity.
You identify equilibrium by locating the point where the two curves cross, then reading price and quantity directly from the axes.
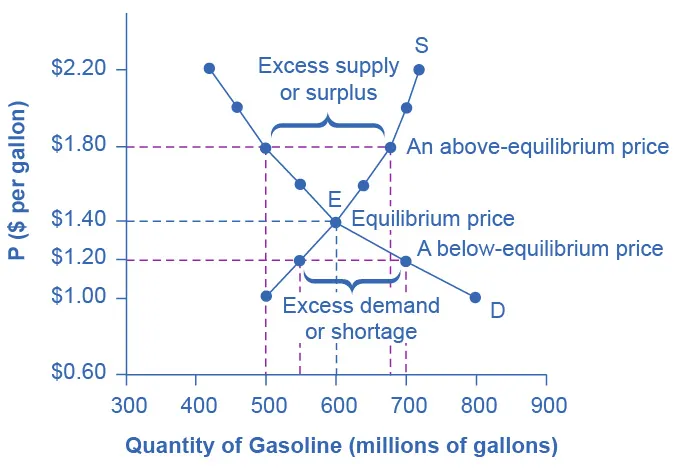
OpenStax’s gasoline market example plots demand and supply together and labels the equilibrium point . The graph emphasizes the practical skill of reading equilibrium price and equilibrium quantity directly from the axes at the curves’ intersection. Source
The equilibrium condition (what must be true)
= quantity demanded at a given price (units per time period)
= quantity supplied at a given price (units per time period)
This condition captures the syllabus requirement: when the equality holds, the corresponding price is the market equilibrium price.
What equilibrium tells you (and what it does not)
Equilibrium provides a precise prediction about:
The price at which the market can clear, given the existing demand and supply relationships.
The quantity exchanged, based on buyers’ and sellers’ plans at that price.
Equilibrium does not, by itself, claim:
That the outcome is fair or socially optimal.
That every participant is satisfied (some consumers may still be priced out; some firms may earn low profits).
That the equilibrium will be the same across different time horizons or institutional settings.
Interpreting equilibrium as coordinated plans
A helpful way to understand equilibrium is to focus on plans:
At the equilibrium price, buyers’ plans (how much they intend to purchase) match sellers’ plans (how much they intend to sell).
Because planned buying equals planned selling, the equilibrium is a consistent outcome for that market at that time.
This is why the equilibrium point is often described as the market’s natural resting point given the current curves: it is the only point on the graph where the two sides’ intended quantities align.
Common AP Macroeconomics pitfalls
Confusing “demand” with “quantity demanded”: equilibrium is found by matching quantities at a particular price, not by assuming demand “equals” supply as abstract concepts.
Reading equilibrium off one curve: you need the intersection of both curves to determine both equilibrium price and equilibrium quantity.
Mixing up axes: price is on the vertical axis and quantity on the horizontal axis in the standard model.
Forgetting the time dimension: the quantity measure is always tied to a time period (per week, per month), even if not explicitly stated.
Practice Questions
(2 marks) Define market equilibrium and state the condition that must hold at equilibrium.
1 mark: Correct definition: equilibrium where quantity demanded equals quantity supplied (at a particular price).
1 mark: Correct condition stated, e.g. .
(5 marks) A market for coffee is in equilibrium at price and quantity . Explain how a student should identify and on a standard supply-and-demand diagram, and explain what “market-clearing” means at .
1 mark: Identify equilibrium as the intersection of supply and demand curves.
1 mark: is the price (y-coordinate) at the intersection.
1 mark: is the quantity (x-coordinate) at the intersection.
1 mark: Define market-clearing: planned quantity demanded equals planned quantity supplied at .
1 mark: State implication: all units buyers plan to buy and sellers plan to sell at can be exchanged.
FAQ
Yes, if the demand and supply curves intersect more than once (for example, with unusual curve shapes). Each intersection represents a price–quantity pair where planned buying equals planned selling.
They combine observed prices/quantities with statistical estimates of demand and supply relationships. Because both curves can shift, economists often use instruments or natural experiments to separate demand movements from supply movements.
Equilibrium quantity is the planned amount exchanged at the equilibrium price. Actual traded quantity can differ if there are frictions such as rationing rules, limited information, or delays in matching buyers and sellers.
Because it is defined by consistency of plans: at the equilibrium price, buyers’ intended purchases equal sellers’ intended sales. That statement can be made without specifying exactly how quickly or through what mechanism the market reaches it.
No. It means that at the equilibrium price, the amount buyers collectively plan to purchase equals the amount sellers plan to sell. Some individual buyers may still choose not to buy at that price or may be unable to afford it.
