
AP Syllabus focus: ‘Changes in determinants of demand or supply shift curves and result in new equilibrium price and quantity.’
Changes in equilibrium explain how markets respond when demand or supply conditions change. You should be able to shift curves correctly, identify the new equilibrium price and equilibrium quantity, and recognise when outcomes are ambiguous.
Core idea: a “new” equilibrium after a shift
Change in equilibrium: A new market-clearing price and quantity that result after the demand curve and/or supply curve shifts due to a change in a non-price determinant.
A shift changes the quantity traded at every price, so the intersection moves to a different point. In contrast, a change in price alone does not shift curves; it changes the quantity demanded or supplied along an existing curve.
What shifts (and what does not)
Demand shifts when a determinant of demand changes (not the good’s own price).
Supply shifts when a determinant of supply changes (not the good’s own price).
A new equilibrium is found where the new curves intersect, holding other factors constant (ceteris paribus).
Demand shifts: effect on equilibrium price and quantity
A demand shift is a rightward or leftward movement of the entire demand curve.
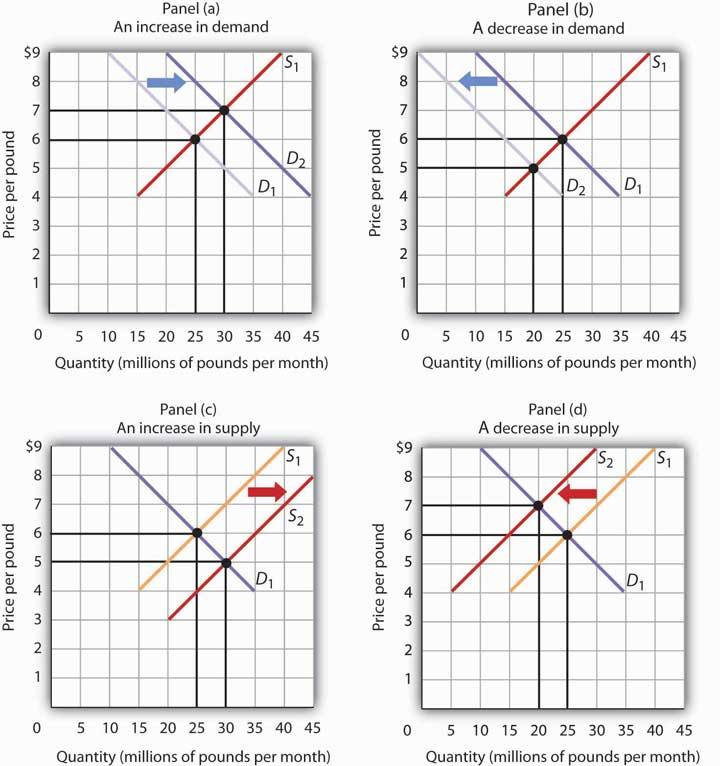
Four separate panels illustrate the standard comparative-statics results for one-curve shifts: demand shifting right/left and supply shifting right/left. Each panel labels the original and new equilibrium points so you can directly read the direction of change in equilibrium price and equilibrium quantity. This is the clean “one shift at a time” baseline used for most AP-style questions. Source
Increase in demand (shift right)
Equilibrium price: rises
Equilibrium quantity: rises
Intuition: buyers are willing and able to purchase more at each price, bidding the market to a higher price while increasing sales.
Decrease in demand (shift left)
Equilibrium price: falls
Equilibrium quantity: falls
Intuition: reduced willingness/ability to buy lowers the price needed to clear the market and reduces output sold.
Supply shifts: effect on equilibrium price and quantity
A supply shift is a rightward or leftward movement of the entire supply curve.
Increase in supply (shift right)
Equilibrium price: falls
Equilibrium quantity: rises
Intuition: firms can produce more at each price, putting downward pressure on price while expanding sales.
Decrease in supply (shift left)
Equilibrium price: rises
Equilibrium quantity: falls
Intuition: higher costs or reduced capacity means less is offered at each price, raising price and lowering quantity traded.
When both demand and supply shift
If both curves shift, the direction of change can be partly predictable and partly uncertain.
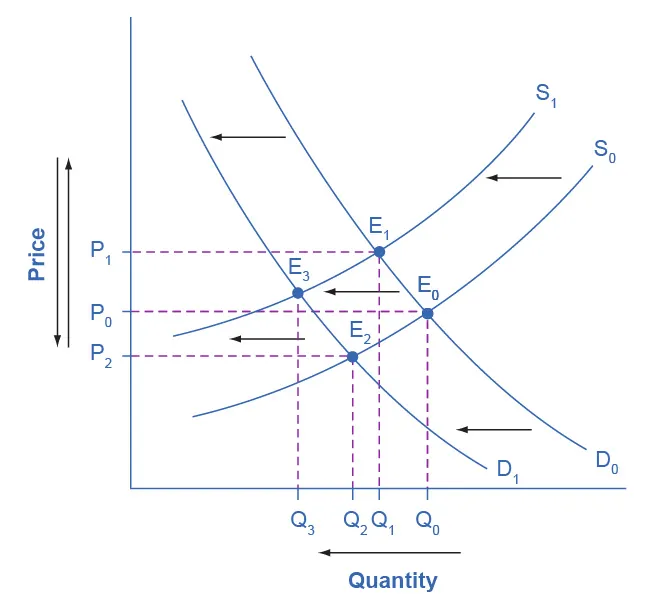
The graph overlays a leftward shift in demand () and a leftward shift in supply (), producing a new equilibrium with a clearly lower quantity but an ambiguous price outcome. Multiple candidate equilibria (e.g., , , ) illustrate how the final price depends on the relative size of the two shifts. This is the visual logic behind writing “depends on relative magnitude of the shifts” when no specific graph is provided. Source
One variable is certain; one may be ambiguous
If demand increases and supply increases:
Equilibrium quantity: increases (certain)
Equilibrium price: ambiguous (depends on relative shift sizes)
If demand decreases and supply decreases:
Equilibrium quantity: decreases (certain)
Equilibrium price: ambiguous
If demand increases and supply decreases:
Equilibrium price: increases (certain)
Equilibrium quantity: ambiguous
If demand decreases and supply increases:
Equilibrium price: decreases (certain)
Equilibrium quantity: ambiguous
How to handle ambiguity on graphs
Use a clear right/left shift and compare the old intersection to the new one.
If asked without a graph, state:
which curve(s) shift,
the certain change (P or Q),
and that the other variable “depends on the relative magnitude of the shifts.”
A reliable procedure for “changes in equilibrium” questions
Identify whether the change affects demand, supply, or both (and the direction).
Shift the correct curve(s); do not move along curves.
Locate the new intersection.
State changes in equilibrium price (P*) and equilibrium quantity (Q*).
If both curves shift, explicitly note any ambiguous result and why.
Practice Questions
(2 marks) A market is initially in equilibrium. Consumer income rises and the good is normal. State the change in equilibrium price and equilibrium quantity.
Equilibrium price rises (1)
Equilibrium quantity rises (1)
(6 marks) In the market for coffee, a new technology reduces production costs while, at the same time, a health study increases consumers’ preference for coffee. Using supply and demand analysis, explain the effect on equilibrium price and equilibrium quantity, and identify any ambiguity.
Lower production costs increase supply / shift supply right (1)
Increased preference increases demand / shift demand right (1)
Equilibrium quantity increases (1)
Equilibrium price is ambiguous because demand pushes price up while supply pushes price down (2)
Correct explanation that the net price change depends on the relative size of the shifts (1)
FAQ
If the good’s own price changes, you move along the curve (change in quantity demanded/supplied).
If any other factor changes (a determinant), the whole curve shifts.
The size depends on:
how far the curve shifts (strength of the determinant change)
the slopes/elasticities of demand and supply
Steeper (more inelastic) curves tend to produce larger price changes and smaller quantity changes.
Because demand and supply can push price (or quantity) in opposite directions.
Without knowing which shift is larger, you cannot determine the net direction for the ambiguous variable.
In the standard model, no: equilibrium changes only when at least one curve shifts.
Price adjustments from a temporary imbalance are movements back toward the existing equilibrium, not a new equilibrium.
Name both shifts and give the certain result first.
Then state: “The effect on $P^*$ (or $Q^*$) is indeterminate because the two shifts work in opposite directions; it depends on which shift is larger.”
