
AP Syllabus focus: ‘The shape of the PPC depends on whether opportunity costs are constant, increasing, or decreasing.’
A production possibilities curve (PPC) is not just a boundary; its curvature communicates how quickly trade-offs intensify as production shifts. Understanding PPC shape helps you interpret opportunity cost patterns and the underlying flexibility of resources.
Interpreting PPC shape through opportunity cost
The PPC’s shape summarizes how costly it is to reallocate scarce resources between two outputs. Moving along a PPC means producing more of one good and less of the other; the opportunity cost is the amount of the other good given up.
Opportunity cost: the value of the next-best alternative forgone when a choice is made.
A key idea is that the PPC’s slope changes (or doesn’t) depending on whether opportunity cost is constant, increasing, or decreasing. When you read a PPC, focus on how the trade-off evolves as you move from one end to the other.
Slope as a compact way to express trade-offs
A PPC is typically drawn with Good X on the horizontal axis and Good Y on the vertical axis. The slope at a point indicates the trade-off rate between X and Y.
= units of forgone per additional unit of
= decrease in output (units of )
= increase in output (units of )
If the absolute value of the slope gets larger as you move rightward, opportunity cost is rising; if it stays the same, opportunity cost is constant; if it gets smaller, opportunity cost is falling.
Constant opportunity cost (linear PPC)
A linear PPC implies constant opportunity cost: every additional unit of X costs the same amount of Y, regardless of the starting point on the curve.
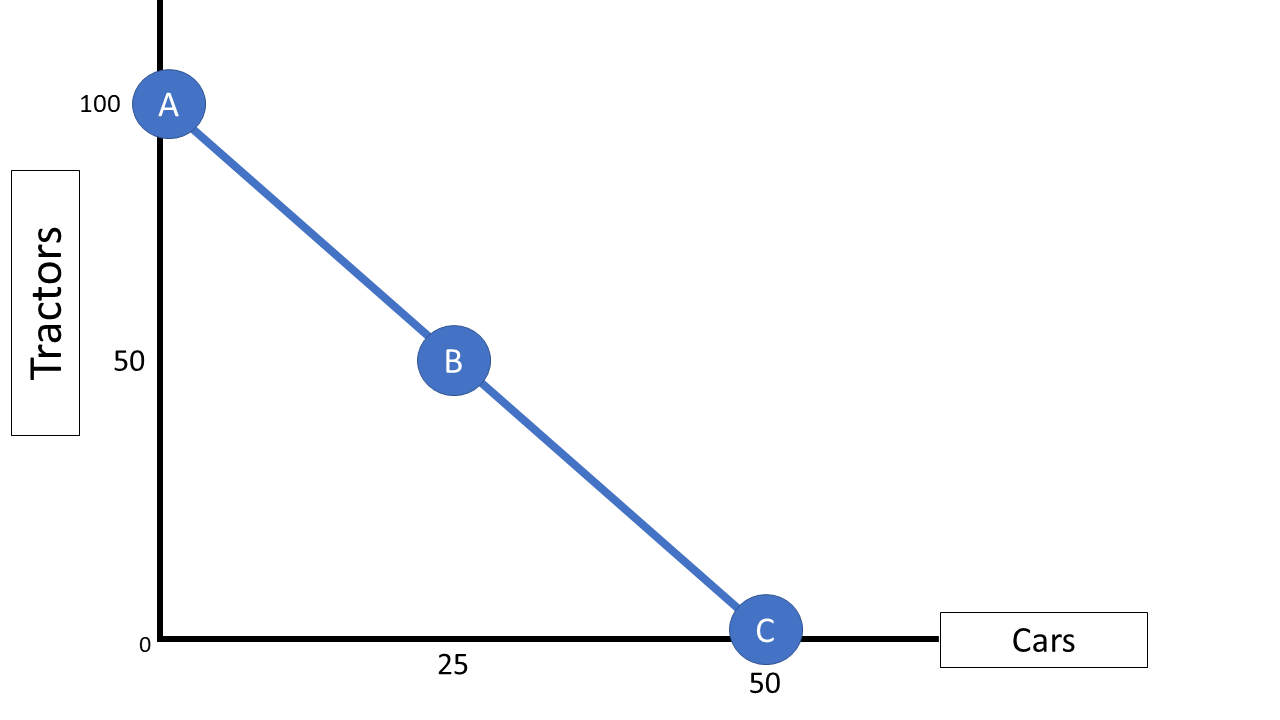
A straight-line production possibilities curve (PPC) showing a constant trade-off between two goods. Because the slope is the same at every point on the line, the opportunity cost per additional unit of one good is constant in terms of the other good. Source
What constant opportunity cost suggests
Resources are equally adaptable between the two goods.
The production processes use inputs in ways that can be reallocated without changing productivity much.
The economy can “swap” capacity between goods at a stable trade-off rate.
How it appears on a graph
The PPC is a straight line.
The slope (in absolute value) is constant along the entire curve.
Moving from one point to another along the PPC does not change the marginal sacrifice rate.
Increasing opportunity cost (bowed-out PPC)
A bowed-out (concave) PPC—the most common case in microeconomics—implies increasing opportunity cost: producing more of X requires giving up ever-larger amounts of Y.
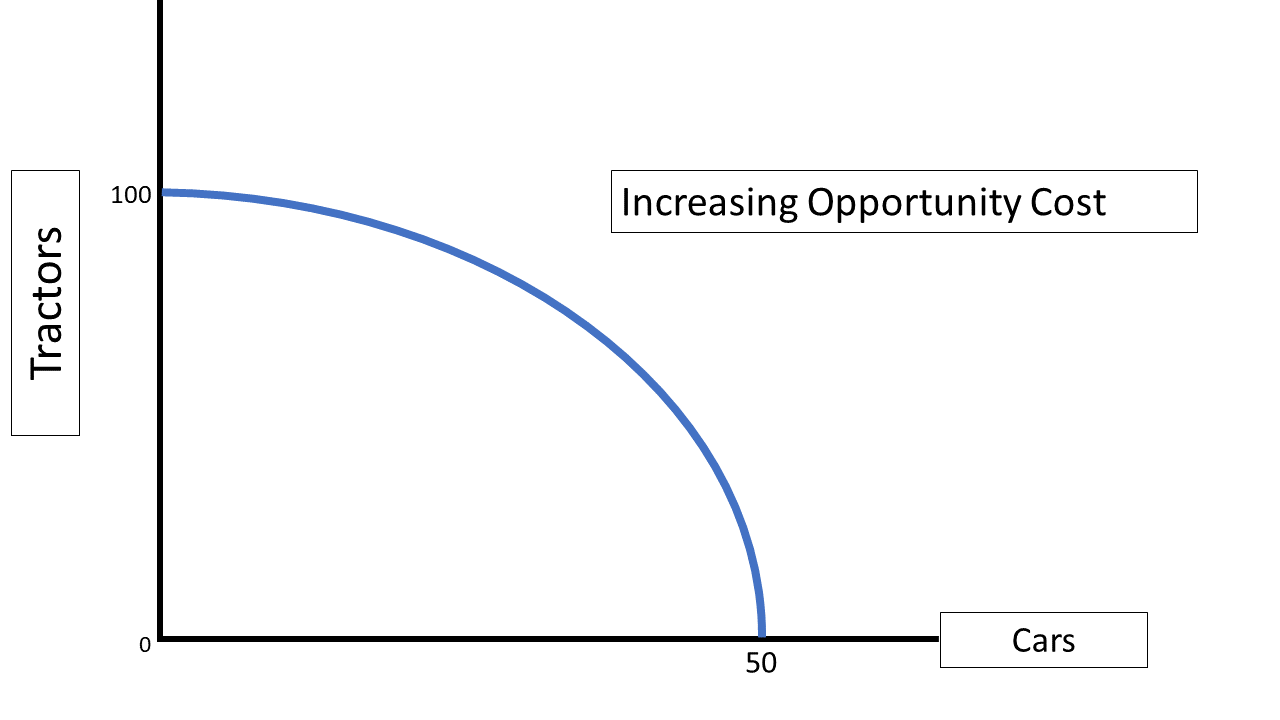
A bowed-out (concave) PPC that illustrates increasing opportunity cost: as the economy reallocates resources toward producing more of one good, each additional gain requires a larger sacrifice of the other good. The curvature captures the idea that resources are not perfectly adaptable across uses, so the marginal trade-off worsens as specialization increases. Source
Why opportunity cost increases
Increasing opportunity cost is typically driven by resource specialization and diminishing marginal returns to reallocated inputs:
Some resources are better suited to producing Y than X (or vice versa).
Early reallocation shifts the most adaptable resources first (low cost).
Later reallocation forces the economy to shift increasingly ill-suited resources (higher cost), reducing efficiency in the expanding sector and/or sharply reducing output in the shrinking sector.
How it appears on a graph
The PPC bows outward from the origin.
The slope becomes steeper (in absolute value) as you move toward producing more of one good.
The trade-off intensifies: small gains in one output require large sacrifices of the other.
Decreasing opportunity cost (bowed-in PPC)
A bowed-in (convex) PPC implies decreasing opportunity cost: as production of X expands, each additional unit of X costs fewer units of Y.
When decreasing opportunity cost can make sense
While less common in standard PPC setups, decreasing opportunity cost can arise when:
Inputs become more productive in the expanding good as scale increases (for example, improved coordination or task matching).
The economy initially reallocates poorly suited resources, then later reallocates better-suited resources.
Production exhibits strong complementarities that make additional reallocation progressively easier.
How it appears on a graph
The PPC bows inward toward the origin.
The slope becomes flatter (in absolute value) as you move rightward.
The trade-off weakens: expanding one output becomes progressively less costly in terms of the other.
Why this matters for AP Microeconomics
PPC shape is a fast diagnostic tool for identifying the pattern of marginal opportunity cost, which is central to reasoning about real-world allocation problems. When asked to interpret a PPC, you are usually being asked to infer whether costs of switching production are stable, rising, or falling, and what that implies about the underlying production trade-offs.
Practice Questions
(2 marks) State which PPC shape corresponds to increasing opportunity costs and briefly explain why.
1 mark: Identifies bowed-out/concave PPC.
1 mark: Explains opportunity cost rises as resources become less suited to the expanding good (specialisation).
(6 marks) Explain how the shape of a PPC reflects whether opportunity cost is constant, increasing, or decreasing. In your answer, relate each case to what it implies about resource adaptability between the two goods.
1 mark: Linear PPC linked to constant opportunity cost.
1 mark: Explanation of constant cost via equally adaptable resources.
1 mark: Bowed-out/concave PPC linked to increasing opportunity cost.
1 mark: Explanation using resource specialisation/less suitable resources reallocated later.
1 mark: Bowed-in/convex PPC linked to decreasing opportunity cost.
1 mark: Explanation using increasing ease/productivity of reallocation or better-suited resources shifted later.
FAQ
Yes. Different ranges can reflect different technologies or factor constraints, creating changing trade-off regimes across output intervals.
Look at curvature: if it becomes steeper (in absolute value), opportunity cost is rising; if slope is constant, cost is constant; if it flattens, cost is falling.
Often. In the long run, resources can be retrained or repurposed, making the PPC closer to linear (more adaptable) than in the short run.
Because factors of production are typically specialised; reallocating away from a good eventually uses increasingly ill-suited inputs, raising marginal sacrifice.
No. Scarcity remains; decreasing opportunity cost only means the trade-off rate improves over a range, not that resources are unlimited.
