
AP Syllabus focus: ‘The production possibilities curve is a model that shows the trade-offs involved in allocating scarce resources between outputs.’
The production possibilities curve (PPC) is a simple but powerful visual model of an economy’s production limits. It helps you interpret feasible output combinations, trade-offs, and the role of scarce resources in constraining choices.
Core idea of the PPC
Production possibilities curve (PPC): a graph showing the maximum attainable combinations of two outputs that can be produced using scarce resources and existing technology, assuming resources are used fully and efficiently.
The PPC is a frontier: it marks the boundary between what an economy can produce and what it cannot, given current productive capacity.
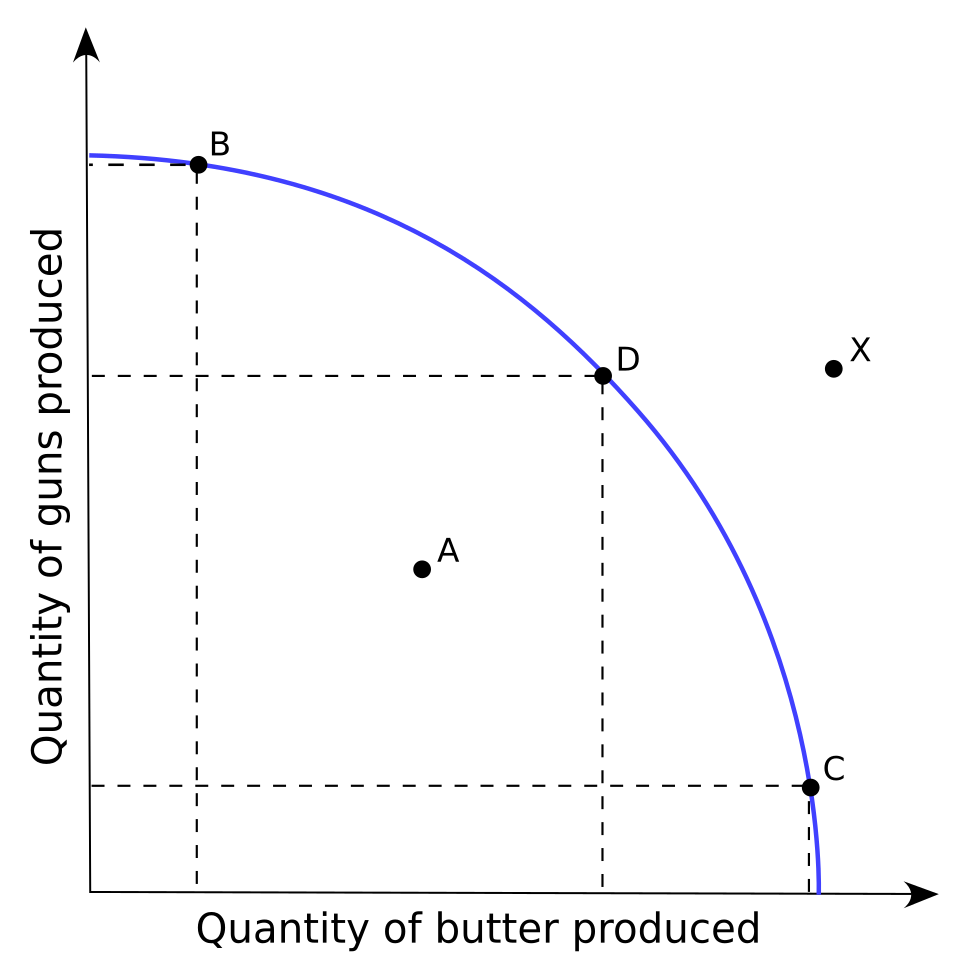
This figure shows a production possibilities frontier (PPF/PPC) as the boundary of maximum attainable combinations of two goods. Points on the curve represent productive efficiency (full, efficient use of resources), while points inside are feasible but inefficient and points outside are unattainable with current resources and technology. Source
What the axes represent
A PPC always plots two outputs (two goods or categories of goods). The choice of two outputs is a modeling convenience that allows trade-offs to be shown clearly.
Each axis measures the quantity produced of one output over a specific time period (for example, per day or per year).
The units depend on the output (tons, units, services delivered, etc.).
The model does not require money prices; it is about real production possibilities.
The frontier and the feasible set
The PPC separates three regions:
This diagram is designed for practice identifying the three key PPC regions: points on the frontier (efficient), points inside (inefficient but attainable), and points outside (unattainable). It works well as a quick visual checklist for graph-reading questions, where the main task is classifying points relative to the curve. Source
On the curve: output combinations that are maximally attainable given the economy’s constraints.
Inside the curve: output combinations that are attainable but do not use the economy’s productive potential fully (the economy could produce more of at least one output without producing less of the other).
Outside the curve: output combinations that are not attainable with current resources and technology.
When you read a PPC, always interpret points as combinations (bundles) of the two outputs, not as single-output “totals.”
What the PPC shows about scarcity and trade-offs
The PPC directly reflects the syllabus idea that it “shows the trade-offs involved in allocating scarce resources between outputs.”
Scarcity as a production constraint
Because resources are limited, an economy cannot produce unlimited amounts of everything. The PPC visualizes this constraint:
If you want more of one output, you generally must accept less of the other output.
This constraint exists even when resources are used as well as possible.
Trade-offs from resource reallocation
A move along the PPC represents a change in the economy’s production mix.
Producing more of one output requires shifting factors of production (land, labour, capital, entrepreneurship) toward that output.
Those factors are then less available for producing the other output.
The PPC therefore depicts the real choices societies face when deciding production priorities.
Interpreting movement along the curve
Movements along the curve should be read as a change in “what we choose to make,” not a change in overall capacity.
Moving rightward (more of the x-axis good) typically implies moving downward (less of the y-axis good).
The relevant interpretation is the trade-off between the two outputs at the margin as production shifts from one to the other.
Assumptions behind the PPC model
The PPC is a model, so it relies on simplifying assumptions that make the trade-offs visible and the graph interpretable.
Holding resources and technology constant
A PPC is drawn for a given set of conditions:
The quantity and quality of resources are treated as fixed.
The level of technology is treated as fixed.
The time period is fixed (shorter periods often imply tighter constraints).
These assumptions ensure the PPC represents a stable “snapshot” of productive capacity rather than a moving target.
Productive efficiency as a baseline condition
To interpret the PPC correctly, the curve is typically constructed under the assumption of full and efficient use of resources.
Points on the curve represent outcomes where production is pushed to its limit for that mix.
This is why the curve is best understood as a boundary for “maximum possible” combinations.
Common graph-reading pitfalls
Students often lose points by misreading what a PPC is (and is not) showing.
Confusing the PPC with demand: a PPC does not show what people want; it shows what the economy can produce.
Ignoring the time dimension: “possible” depends on the stated period; capacity is not the same in a week versus a year.
Treating the curve as a single-output limit: the PPC is about two-output trade-offs, so every point must be read as a bundle.
Practice Questions
Question 1 (3 marks) Define a production possibilities curve (PPC) and state what a point outside the PPC indicates.
1 mark: Defines PPC as maximum attainable combinations of two outputs given scarce resources and current technology.
1 mark: Mentions PPC shows trade-offs/production limits (boundary/frontier).
1 mark: States a point outside is unattainable with current resources/technology (in that time period).
Question 2 (6 marks) An economy produces only medical masks and laptops. Using the PPC model, explain what it means if the economy moves from one point on its PPC to another point on the same PPC, and what the PPC illustrates about scarcity and choice.
1 mark: Correctly identifies movement along the same PPC as a change in the production mix (reallocation between outputs).
1 mark: Explains more of one good implies less of the other (trade-off).
1 mark: Links trade-off to scarce factors of production being shifted between industries.
1 mark: States PPC shows the maximum feasible combinations/boundary of production.
1 mark: Explains scarcity as limited resources preventing unlimited production of both goods.
1 mark: Connects scarcity to the need for choice between competing uses of resources.
FAQ
Two goods makes the trade-off visual and testable.
Each “good” can represent a broad category (e.g., consumer goods vs capital goods).
Yes—services can be an axis.
The key is that the service must be measurable as an output per time period.
An economy’s productive capacity, mainly:
quantity/quality of resources
available technology
institutional ability to mobilise resources
A PPC is a production-capacity limit for an economy.
A budget constraint is a spending limit for a consumer (or firm) based on income and prices.
They may use production data and capacity measures (e.g., utilisation rates).
They also use engineering/industry constraints to approximate feasible output bundles under current technology.
