
AP Syllabus focus: ‘Marginal analysis compares the additional benefit of an activity with its additional cost when deciding whether to change quantity.’
Marginal analysis is the core decision tool in microeconomics: it evaluates small changes rather than totals. Consumers and firms use it to decide whether to increase, decrease, or maintain an activity level given constraints.
What “thinking at the margin” means
Economic decision-makers rarely choose between “all or nothing.” Instead, they adjust quantity (buying one more unit, producing one more unit, working one more hour) and ask whether that small change improves outcomes.
Marginal means “additional” or “next unit.”
Marginal analysis focuses on how benefits and costs change when quantity changes by one unit.
The key comparison is between the additional benefit gained and the additional cost incurred from a small increase (or decrease) in an activity.
Core terms used in marginal analysis
Marginal benefit (MB): The additional benefit received from consuming or producing one more unit of an activity.
Marginal benefits are often measured differently depending on the decision-maker:
For consumers, MB is commonly interpreted as the additional satisfaction (willingness to pay) from one more unit.
For firms, MB is commonly interpreted as the additional revenue from selling one more unit (in many AP contexts, this is closely tied to marginal revenue, but the general “additional benefit” idea is what matters here).
Marginal cost (MC): The additional cost incurred from consuming or producing one more unit of an activity.
Marginal costs also depend on context:
For consumers, MC is often the price of one more unit (plus any additional non-price costs like time or effort when relevant).
For firms, MC is the additional production cost of one more unit (driven by input use, productivity, and capacity constraints).
The marginal decision rule (increase, decrease, or hold)
Marginal analysis provides a simple, disciplined rule for adjusting quantity. Decision-makers compare MB and MC for the next unit (or the last unit changed).
If MB > MC, increasing the activity raises net gains, so the decision-maker has an incentive to do more.
If MB < MC, increasing the activity reduces net gains, so the decision-maker has an incentive to do less.
If MB = MC, the decision-maker is at the point where small changes do not improve net gains, so they should not change quantity.
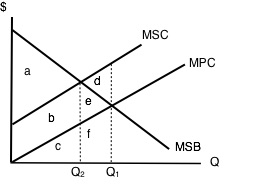
This diagram plots marginal benefit (MSB/MB) and marginal cost (MSC/MC) against quantity, highlighting the efficient output where the two curves intersect. To the left of the intersection, so expanding quantity increases net gains; to the right, so additional units reduce net gains. Source
This logic applies to choices like:
Consumers adjusting how many units to buy at a given price
Firms adjusting output when considering whether producing an extra unit is worthwhile
Marginal net benefit as a single metric
It is often helpful to combine MB and MC into one “net” measure that indicates whether a marginal change improves outcomes.
= additional net gain from one more unit (benefit units)
= additional benefit from one more unit (benefit units)
= additional cost from one more unit (cost units)
When is positive, increasing quantity improves the decision-maker’s outcome; when negative, it worsens it.
Applying marginal analysis: consumers vs. firms
The structure of the decision is the same (compare additional benefit to additional cost), but what counts as “benefit” and “cost” differs.
Consumers: whether to buy one more unit
For a consumer choosing quantity of a good:
MB reflects the value the consumer places on the next unit (how much it is worth to them at the margin).
MC is typically the market price of the next unit (and, in broader interpretations, any extra time/effort costs tied to obtaining it).
A consumer will tend to:
buy additional units as long as the next unit’s MB is at least as large as MC
stop increasing purchases when the next unit’s MB falls to MC (or when MB would drop below MC)
This aligns with the idea that the consumer is making the best feasible adjustment given limited income and market prices, without requiring a comparison of total satisfaction versus total spending.
Firms: whether to produce one more unit
For a firm choosing output:
MB is the additional gain from selling one more unit (often captured as additional revenue).
MC is the additional cost of producing one more unit (extra labor, materials, energy, and other variable inputs).
A firm will tend to:
expand output when producing and selling the next unit adds more to benefits than it adds to costs (MB > MC)
reduce output when the next unit adds more to costs than to benefits (MB < MC)
avoid changing output when marginal gains from changing output are exhausted (MB = MC)
Why marginal analysis is powerful in microeconomics
Marginal analysis helps decision-makers avoid common errors that come from focusing on averages or totals.
Totals can be misleading: a high total benefit does not imply the next unit is worth it.
Averages can hide trade-offs: average cost or average satisfaction does not determine whether one more unit improves outcomes.
Real decisions are incremental: many choices are made by adjusting quantity up or down, not by redesigning everything from scratch.
Common pitfalls to avoid (within marginal analysis)
Treating MB and MC as fixed: in many settings, MB changes with quantity (often falling as you do more), and MC changes with quantity (often rising as capacity tightens).
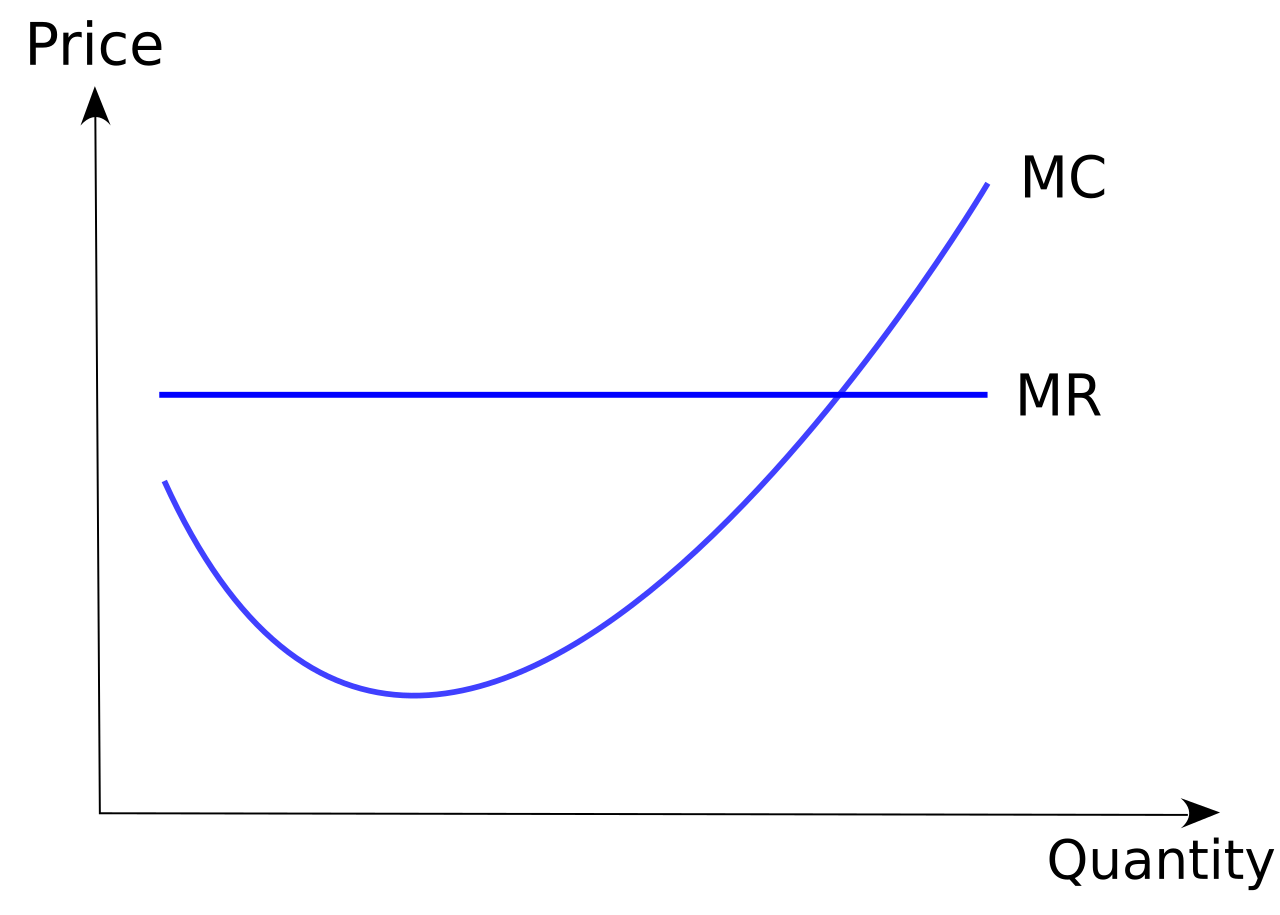
This figure illustrates a typical short-run marginal cost (MC) curve, which is often U-shaped as output expands. It visually reinforces that marginal cost is not constant: MC can fall at low output and then rise as diminishing marginal returns and capacity constraints make additional units more expensive. Source
Confusing marginal and average: MC is not the same as average cost, and MB is not the same as average benefit.
Ignoring the relevant “next unit”: the correct comparison is for the incremental unit being considered, not a different unit or an average across all units.
Practice Questions
Question 1 (3 marks) Define marginal analysis and state the marginal decision rule for whether to increase an activity.
1 mark: Defines marginal analysis as comparing additional (marginal) benefits with additional (marginal) costs when changing quantity.
1 mark: States increase activity if .
1 mark: States decrease activity if or no change when .
Question 2 (6 marks) Explain how marginal analysis applies to (i) a consumer choosing how many units of a good to buy and (ii) a firm deciding whether to increase output. In your answer, refer to marginal benefit and marginal cost.
1 mark: Identifies consumer’s marginal benefit as additional satisfaction/willingness to pay from one more unit.
1 mark: Identifies consumer’s marginal cost as the price (and/or additional acquisition cost) of one more unit.
1 mark: Explains consumer increases purchases when and stops changing when .
1 mark: Identifies firm’s marginal benefit as additional revenue/benefit from selling one more unit.
1 mark: Identifies firm’s marginal cost as additional production cost of one more unit.
1 mark: Explains firm increases output when and reduces/does not increase when (with implying no incentive to change).
FAQ
Use the same logic but compare the benefit and cost of the smallest feasible increment (e.g., adding a shift, buying a machine, expanding by one room).
If increments are large, decision-makers often:
compare several discrete options’ marginal changes
account for risk by using expected marginal benefits and costs
Yes, in cases with network effects or learning-by-doing on the consumer side.
Examples include:
products that become more valuable when more people use them
complementary adoption (a second unit enables new uses)
In such cases, the marginal decision rule still applies; it’s just that $MB$ may rise over some range.
Marginal cost is the extra cost of one more unit to the consumer.
Marginal expenditure is specifically the extra spending caused by buying one more unit. Under simple per-unit pricing, they match. They can differ when:
bulk discounts apply
tiered pricing or subscription bundles change the cost of the next unit
Firms typically approximate:
marginal cost from engineering cost studies, input requirements, and short-run variable cost data
marginal benefit from pricing data, demand estimates, and observed changes in revenue with output
They often update estimates as conditions change (input prices, productivity, demand).
Under uncertainty, decision-makers compare expected marginal benefit and expected marginal cost.
They may also incorporate:
a risk premium (requiring $MB$ to exceed $MC$ by more than zero)
option value (waiting when information is likely to improve)
