
AP Syllabus focus: ‘Deadweight loss measures the losses to buyers and sellers caused by government intervention in an efficient market.’
Deadweight loss (DWL) explains why some policies reduce the overall gains from trade. This page focuses on how interventions prevent mutually beneficial exchanges, shrinking total surplus in an otherwise efficient competitive market.
Deadweight loss and the efficient benchmark
In a perfectly competitive market with no market failure, the equilibrium quantity is efficient because all trades with benefits at least as large as costs occur.
Deadweight loss (DWL): the reduction in total surplus (consumer surplus + producer surplus) caused by an intervention that prevents mutually beneficial trades.
DWL is a loss of net benefits, not a transfer from one group to another; it represents gains from trade that disappear because fewer units are bought and sold than the efficient outcome.
The “last unit” logic (marginal benefit vs marginal cost)
For units near the competitive equilibrium, marginal benefit to buyers (willingness to pay) and marginal cost to sellers (opportunity cost) are approximately equal.
If an intervention reduces quantity below the efficient level, some units with marginal benefit > marginal cost are not traded.
The foregone net benefit on those units is the DWL.
How intervention creates DWL
Government intervention creates a wedge between what buyers pay and what sellers receive, or it directly restricts the quantity traded.
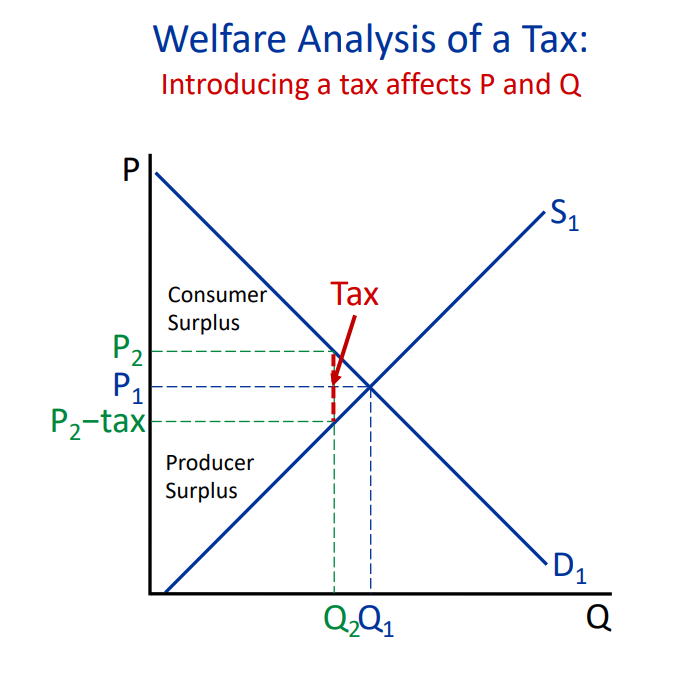
This supply-and-demand diagram visualizes a per-unit tax creating a wedge between the price consumers pay and the price producers receive. Quantity falls from the efficient level () to the post-tax level (), which is the mechanism that generates deadweight loss. The figure also helps students separate surplus changes from the wedge-driven reduction in trades. Source
Either way, the key mechanism is that the quantity exchanged moves away from the efficient quantity.
Common ways an efficient market can be pushed away from its efficient quantity include:
Taxes: raise buyers’ price and/or lower sellers’ received price, reducing quantity traded.
Subsidies: encourage trades where marginal cost exceeds marginal benefit, potentially increasing quantity beyond efficient.
Binding price controls (price ceilings or floors): prevent the market-clearing price, leading to rationing and fewer mutually beneficial trades.
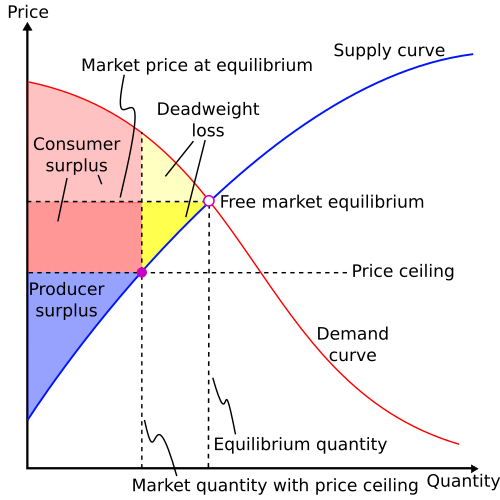
This diagram illustrates a binding price ceiling that lowers the quantity traded below the competitive equilibrium, eliminating some mutually beneficial exchanges. The shaded triangle marks the deadweight loss: the net gains from trade that would have existed between the reduced quantity and the efficient quantity. It reinforces the idea that DWL is an efficiency loss (lost total surplus), not a transfer. Source
Identifying DWL on the supply-and-demand graph
On standard supply-and-demand diagrams:
The demand curve represents marginal benefit.
The supply curve represents marginal cost.
DWL is the area of net benefits from trades that no longer happen (or trades that happen even though they are inefficient), typically drawn as a triangle between supply and demand over the “missing” (or “extra”) units.
A convenient geometric way to express that lost triangle is:
= the change in quantity traded relative to the efficient quantity (units of the good)
= the size of the wedge between marginal benefit and marginal cost over those units (dollars per unit)
This formula reflects that DWL grows with both the number of trades distorted and the per-unit distortion.
What counts as DWL (and what does not)
DWL includes only the lost surplus from trades that do not occur (or the negative surplus from inefficient extra trades).
Transfers are not DWL:
Tax revenue collected by the government is a transfer (buyers/sellers lose, government gains).
Subsidy spending is a transfer in the opposite direction (government loses, buyers/sellers gain).
DWL is the part that is not captured by anyone.
What determines the size of DWL
DWL is larger when an intervention causes a larger change in quantity from the efficient outcome. Key drivers:
Elasticities: More elastic supply and demand generally mean a bigger quantity response to a given wedge, creating larger DWL.
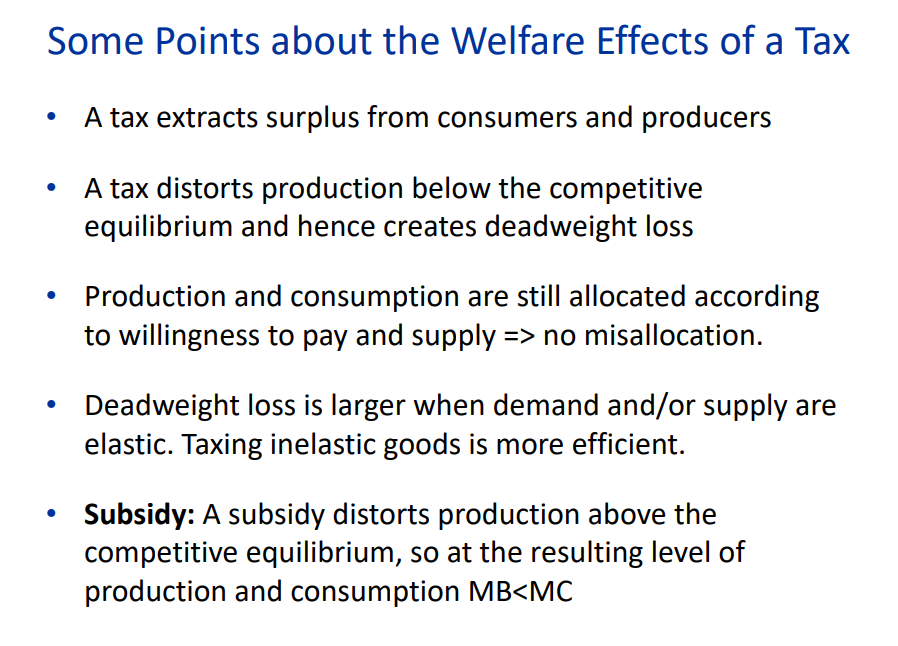
This slide summarizes the key comparative-static result: deadweight loss is larger when demand and/or supply are more elastic because the quantity response to a wedge is bigger. Conceptually, a more elastic curve makes the “missing trades” base of the DWL triangle larger for a given per-unit distortion. It’s a compact visual cue for why taxing relatively inelastic goods tends to create less DWL than taxing elastic goods. Source
Size of the wedge: Larger taxes, larger binding gaps between controlled price and equilibrium price, or larger per-unit subsidies tend to increase DWL.
How binding the policy is: If a price control is not binding (does not constrain equilibrium), DWL is zero because quantity and price remain at the efficient outcome.
Common pitfalls
Confusing DWL with the entire loss in consumer surplus or producer surplus (some of that loss may be transferred to others).
Labeling shortage or surplus amounts as DWL; DWL is an area of lost net benefits, not a quantity.
Forgetting that DWL analysis here assumes the original equilibrium was efficient (no externalities or other market failures).
Practice Questions
(2 marks) Define deadweight loss and explain, in one sentence, why a binding government intervention can create it.
1 mark: Correct definition: reduction in total surplus due to fewer/more inefficient trades.
1 mark: Explains that intervention moves quantity away from the efficient level, preventing mutually beneficial exchanges (or causing inefficient ones).
(5 marks) A per-unit tax is introduced in a previously efficient competitive market. Using supply and demand reasoning, explain what deadweight loss is in this context and state two factors that would increase its size.
1 mark: States that the tax creates a wedge between price paid and price received.
2 marks: Explains DWL as lost total surplus from mutually beneficial trades that no longer occur because quantity falls below the efficient quantity.
1 mark: Factor 1 that increases DWL (e.g., more elastic supply and/or demand).
1 mark: Factor 2 that increases DWL (e.g., larger tax per unit / larger wedge / more binding distortion).
FAQ
No. DWL is the part of the lost consumer and producer surplus that is not offset by a gain elsewhere.
Some losses become transfers (for example, tax revenue). DWL is only the net loss of gains from trade.
Because the per-unit net benefit of the marginal lost trades typically changes gradually as quantity moves away from the efficient point.
The triangle summarises the cumulative lost net benefits over the range of units no longer traded.
Yes. If one side of the market is perfectly inelastic, quantity does not change when the wedge is introduced.
With no change in quantity, there are no prevented trades, so DWL is zero (even though there can still be large transfers).
In public finance, DWL is often called the excess burden of a tax: the welfare cost beyond the revenue raised.
It highlights that raising a given amount of revenue can have different efficiency costs depending on behavioural responses.
Not necessarily. DWL here is defined relative to an initially efficient market.
If the original market had unpriced costs or benefits, reducing quantity could, in principle, reduce an existing inefficiency rather than create a new one.
