AP Syllabus focus: 'Electric field maps use vectors to depict field magnitude and direction. Electric field line diagrams are simplified models used to determine relative magnitude and direction.'
Electric field diagrams let physicists visualize how the field varies from place to place. In AP Physics 2, you should be able to read both vector field maps and field line diagrams and extract meaning from each.
Electric Field Maps
An electric field map shows the electric field at many individual points in space. Each arrow is a vector drawn at a specific location, so the map communicates two pieces of information at once: direction and magnitude. Because electric field is a vector quantity, a field map is often the clearest way to see how the field varies from point to point.
Electric field map: A representation that uses arrows at selected points to show the electric field's direction and relative magnitude.
On a vector field map:
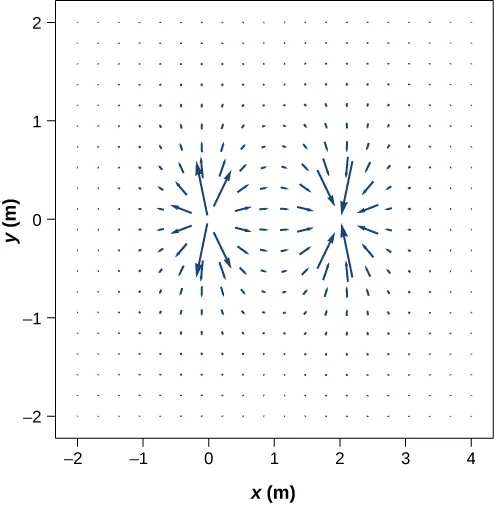
Vector field map of an electric dipole: each arrow shows the electric field vector at that point. The arrow direction gives the local field direction, while the arrow length qualitatively indicates field strength. Notice how the vectors change direction rapidly near and between the charges, illustrating a strongly nonuniform field. Source
the arrow points in the direction of the electric field at that point
a longer arrow represents a stronger field
a shorter arrow represents a weaker field
changes in arrow orientation show changes in field direction across space
When reading a map, focus on one location at a time. The arrow there tells you the local field, not the motion of a charged object through the whole region. If neighboring arrows all point the same way and have similar lengths, the field is approximately uniform in that region. If the arrows change rapidly in size or direction, the field is nonuniform.
Field maps are especially useful when you need to compare the field at specific labeled points. They can also show subtle changes that may be hard to see with field lines alone, such as gradual turning of the field or small differences in strength.
Electric Field Line Diagrams
An electric field line diagram is more visual and more global. Instead of giving separate arrows at selected points, it draws continuous lines that represent the overall pattern of the field.
Electric field line diagram: A simplified representation that uses continuous lines to show electric field direction and relative field strength.
These diagrams are simplified models. They are designed to help you determine relative magnitude and direction, not to provide an exact numerical value for the field at every point.
Key reading rules:
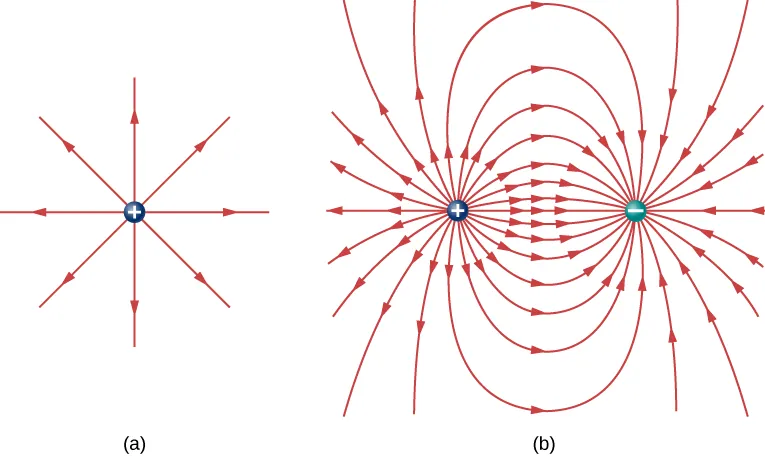
Electric field line diagrams for (a) a single positive point charge and (b) a dipole. The electric field direction at any point is tangent to the field line, and arrowheads indicate the direction from positive to negative. Regions where field lines crowd together correspond to larger electric field magnitude (greater line density). Source
the field direction at any point is tangent to the field line there
arrows on the lines, when included, show the field direction
regions where lines are closer together represent stronger fields
regions where lines are farther apart represent weaker fields
A field line diagram is useful for seeing the broad structure of the field around charges or arrangements of charges. It helps you recognize whether the field spreads outward, curves, or becomes nearly parallel in some region. Because the lines are continuous, the diagram often makes the overall geometry easier to interpret than a set of many separate arrows.
However, field lines are not physical strings in space.
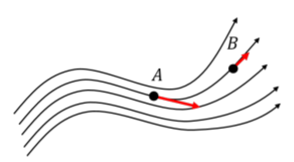
Example showing how to read a local electric field vector from a field-line diagram at specific points (A and B). At each point, the electric field vector points tangent to the field line, with the arrow direction matching the line’s indicated direction. The field is stronger where the field lines are more concentrated, so the diagram supports relative magnitude comparisons between locations. Source
They are a drawing convention used to visualize a vector field. Their spacing and number are chosen by the person making the diagram, so you should treat them as a tool for relative comparison within the same figure.
Comparing the Two Representations
A vector field map and a field line diagram describe the same underlying electric field, but they emphasize different features.
Field maps are best for identifying the field vector at particular points.
Field line diagrams are best for seeing the overall shape of the field and how its strength changes qualitatively.
On an AP Physics 2 problem, decide what the diagram is telling you before answering. If the figure uses arrows at separate points, compare arrow length and direction directly. If it uses field lines, compare line density and the local tangent direction.
For example, if point A lies where the arrows are longer than at point B, or where the field lines are more crowded, then the field magnitude is greater at A than at B. If the arrow at a point points to the right, or if the field line there is locally directed to the right, then the electric field at that point points to the right.
The two diagram types can sometimes appear together. In that case, the vector arrows show the exact local direction chosen at certain points, while the field lines show the broader pattern connecting those directions across the region.
Common Interpretation Pitfalls
Several mistakes appear often when students read electric field diagrams.
Do not confuse a field map with a picture of charge motion. A field vector shows the field at a point, not a drawn path.
Do not assume a field line diagram gives exact numerical values unless a scale is explicitly provided.
Do not compare line spacing from two completely different diagrams unless they were drawn using the same conventions.
Do not ignore location. The electric field can change from one point to another even over small distances.
Do use the diagram type appropriately: arrow length for vector maps, line density for field line diagrams.
When reading any electric field representation, ask two questions first: Which way does the field point here? and How strong is it here compared with elsewhere?
Practice Questions
A field line diagram shows that the lines are closer together at point P than at point Q. At both points, the field lines are directed to the left.
State: a) which point has the greater electric field magnitude b) the direction of the electric field at point P
1 mark for stating that the field magnitude is greater at point P
1 mark for stating that the electric field at point P points to the left
A region of space is shown in two different ways.
In a vector field map, the arrow at point A points to the right and is longer than the arrow at point B, which also points to the right.
In a field line diagram of the same region, the field lines near point A are more closely spaced than the field lines near point B.
Answer the following: a) Compare the electric field magnitudes at A and B.
b) State the direction of the electric field at A.
c) Explain how the field line diagram shows the relative field strength at A and B.
d) Give one reason why the field line diagram is considered a simplified model rather than an exact picture of the field.
1 mark for stating that the electric field magnitude is greater at A than at B
1 mark for stating that the electric field at A points to the right
1 mark for explaining that closer field lines indicate a stronger field
1 mark for applying that idea correctly to conclude that A is in the stronger-field region
1 mark for stating one valid limitation, such as:
it does not give exact numerical field values
the number and spacing of lines depend on how the diagram is drawn
it shows relative magnitude and direction only
FAQ
On a vector field map, a zero-field point may be shown by a very small arrow or by no arrow at all, depending on the drawing style.
On a field line diagram, a zero-field point is harder to show clearly. The diagram may only suggest it indirectly, so vector maps are usually better for identifying such locations.
Sometimes a diagram is designed mainly to emphasize direction, not magnitude.
In that case, the arrows may be scaled similarly so the pattern is easier to see. If that happens, you should not assume arrow length is giving reliable strength information unless the diagram or caption says it does.
Any page drawing is a two-dimensional representation of a three-dimensional situation.
That means some information is compressed or omitted. A diagram may show only a cross section, a slice, or a projected view of the full field. This is one reason field diagrams are models rather than perfect pictures.
Yes, if they preserve the same essential information about local direction and relative strength.
For instance, one diagram may use more lines, smoother curves, or a different artistic style. As long as the tangent directions and crowding patterns are consistent, both can describe the same electric field.
Vector maps make local reasoning easier to check.
A student can point to one location and directly read:
direction from the arrow orientation
relative strength from the arrow length
That often reduces ambiguity, especially when a question asks about one specific point instead of the full field pattern.