
AP Syllabus focus: 'Vectors can be modeled as arrows with appropriate direction and lengths proportional to their magnitudes.'
Visual vector diagrams turn abstract quantities into geometric objects. In mechanics, this helps you compare directions, judge relative size, and communicate physical information clearly without relying only on verbal descriptions.
What a vector diagram shows
A vector is drawn as an arrow because an arrow can display two essential features at once: how large the quantity is and which way it points.
Vector: A quantity represented by both magnitude and direction.
In a visual model, the length of the arrow represents the size of the vector, and the arrowhead shows its direction.
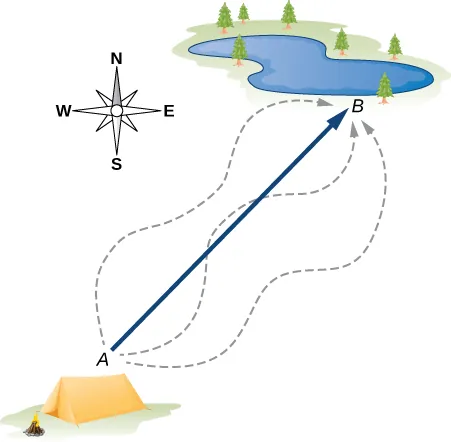
A displacement vector is drawn as a directed arrow from an initial point to a final point. The arrow’s length encodes the vector’s magnitude, and the arrowhead fixes the direction, making the geometric meaning of “magnitude + direction” explicit. Source
This is what makes an arrow a better model than a simple line segment.
The size of a vector is called its magnitude.
Magnitude: The size or numerical amount of a vector, independent of direction.
If two vectors point in the same direction but one has a greater magnitude, the larger one must be drawn as a longer arrow. If two vectors have the same magnitude, they must be drawn with equal lengths, provided the same scale is being used.
Tail and arrowhead
Every vector arrow has a tail and a head:
The tail marks the starting point of the drawn arrow.
The head indicates the direction in which the vector points.
The arrowhead is not decorative. Without it, the drawing does not fully represent the vector, because direction would be ambiguous. A plain line can show length, but only an arrow shows direction and length together.
Length must be proportional to magnitude
The specification says that vector lengths must be proportional to magnitudes. That means the drawing must preserve relative size. If one vector has twice the magnitude of another, its arrow should be twice as long on the page.
This does not mean the arrow length must equal the physical magnitude numerically. Instead, the drawing uses a scale.
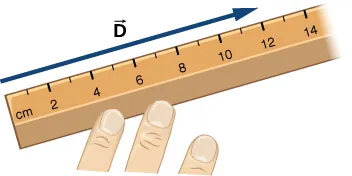
A vector can be drawn “to scale” by choosing a conversion factor between physical magnitude and drawn length (for example, a certain number of centimeters per kilometer). Measuring the arrow on the page then corresponds to the vector’s magnitude under that chosen scale. Source
Scale diagram: A drawing in which measured lengths represent physical magnitudes in a consistent proportion.
A good scale lets the diagram communicate size relationships clearly. For example:
larger vectors are drawn longer
smaller vectors are drawn shorter
equal-magnitude vectors are drawn with equal lengths
all vectors in the same diagram follow the same proportional rule
If the scale changes from one vector to another, the visual comparison becomes misleading. In AP Physics, a diagram is useful only if its geometry matches the physical information it is meant to represent.
Choosing a sensible scale
When making a scale diagram, the scale should produce arrows that are easy to draw and compare. A poor scale can make the diagram hard to read:
a scale that is too small may compress differences in magnitude
a scale that is too large may make arrows awkwardly long
a scale that gives inconvenient fractional lengths may increase drawing error
A neat, readable diagram is part of good physics communication. Even when exact measurement is not required, the visual proportions should still be reasonable.
Direction must be shown accurately
The other essential feature of a vector is direction. In a visual representation, direction is shown by the orientation of the arrow. An arrow pointing right represents a different vector from one pointing left, even if the two arrows have the same length.
“Appropriate direction” means the arrow must match the physical description:
horizontal if the vector is horizontal
vertical if the vector is vertical
slanted at the correct angle if the vector is given at an angle
reversed if the physical direction is opposite
Two vectors can have:
the same magnitude but different directions
the same direction but different magnitudes
both the same magnitude and the same direction
Only the last case represents equal vectors in a visual sense.
Direction is not the same as path
A common mistake is to confuse a vector arrow with the path an object follows. A vector diagram shows a quantity at an instant or as a single directed quantity. It does not automatically show a full trajectory or route.
For this reason, a vector arrow should usually be drawn as a straight arrow with a clear head. The purpose is to encode direction and magnitude, not to sketch motion over time.
Good conventions for drawing vectors
Clear vector diagrams follow a few standard conventions:
draw arrows neatly and distinctly
include an obvious arrowhead
keep the drawing straight unless a different direction is intended
label vectors clearly when more than one appears
use one consistent scale within the same diagram
make relative lengths visually believable
Placement on the page can matter for clarity, but the key information remains the same: direction and proportional length. A messy arrow with the right number written next to it is still a poor representation if the length and orientation do not match the quantity.
Common visual mistakes
Students often lose meaning in vector diagrams by:
drawing arrows with similar lengths for very different magnitudes
forgetting the arrowhead
reversing the direction
changing scale partway through the same figure
relying on labels alone instead of making the geometry match the physics
drawing arrows so carelessly that equal or unequal magnitudes cannot be distinguished
Why visual vector models matter in mechanics
Mechanics relies heavily on vector quantities, so a correct visual model helps you interpret physical situations quickly. A well-drawn vector diagram lets you see size and direction at the same time, check whether relationships are reasonable, and communicate ideas efficiently. In AP Physics C, this kind of representation is not just a sketching skill; it is part of expressing physics precisely.
FAQ
Some vectors are treated as free vectors, meaning only magnitude and direction matter. Displacement and velocity are often handled this way in diagrams, so you can slide them parallel to themselves for clarity.
For other vectors, especially forces, the point where the arrow is applied can matter physically. In that case, moving the arrow may change the meaning of the diagram.
So the answer depends on what the vector represents.
A zero vector has zero magnitude, so it cannot be shown as an ordinary arrow with length. Common choices are:
a labelled point
a very small mark with a label
a written statement that the vector is zero
Because it has no direction, any arrowhead would be misleading. The key idea is that there is no nonzero length to draw.
Not by default. In standard physics diagrams, the mathematical meaning of a vector comes from:
its direction
its length relative to the scale
Thickness, colour, and style usually only improve readability. They matter only if a key or legend says they carry meaning. Without such a key, a thick arrow and a thin arrow can represent the same vector.
A vector angle is normally measured from a stated reference direction, often the positive horizontal axis. In many settings, positive angles are taken counterclockwise.
What matters most is consistency. If a problem says “$30^\circ$ above east,” that is more informative than writing just “$30^\circ$” with no reference line. A diagram should make the reference direction obvious.
Not every textbook or exam figure is intended to be measured exactly. Sometimes a diagram is only schematic, meaning it is meant to show the idea rather than perfect scale.
Small distortions can also come from:
screen resizing
printing
hand-drawn reproduction
Unless the problem explicitly says the diagram is to scale, use the stated information first and the appearance second.
Practice Questions
A vector has magnitude units and points due east. A scale of units is used.
Draw and state what feature of the drawing shows its magnitude and what feature shows its direction.
1 mark for an arrow long pointing east
1 mark for stating that arrow length represents magnitude and the arrowhead/orientation represents direction
Three vectors are represented on the same scale:
has magnitude and points north
has magnitude and points north
has magnitude and points south
Sketch the three vectors on one diagram using a clear scale. Then identify: (a) which pair has equal magnitude (b) which pair has the same direction (c) which pair has equal magnitude but opposite direction
1 mark for choosing or stating a consistent scale
1 mark for drawing and with equal lengths
1 mark for drawing with twice the length of
1 mark for correct directions: and north, south
1 mark for correctly identifying:
(a) and
(b) and
(c) and
