
AP Syllabus focus: 'The slope of a tangent on a position-time graph gives instantaneous velocity, and the slope on a velocity-time graph gives instantaneous acceleration.'
Graphs are not just pictures of motion: in AP Physics C, their slopes encode key dynamical information. Reading those slopes correctly lets you extract velocity and acceleration directly from visual representations.
Why slope matters
Kinematics graphs compare a physical quantity with time. The meaning of a graph is set by its axes, so the same visual shape can represent different physics depending on what is plotted vertically.
When time is on the horizontal axis, slope tells how quickly the vertical quantity changes as time changes. On a position-time graph, slope represents velocity. On a velocity-time graph, slope represents acceleration.
Slope: The rate of change of the vertical-axis quantity with respect to the horizontal-axis quantity.
Because slope is a ratio, its units come from vertical-axis units divided by horizontal-axis units. For position-time graphs, slope units are meters per second. For velocity-time graphs, slope units are meters per second squared.
Average slope and tangent slope
If a graph is straight over an interval, the slope is the same everywhere on that interval. If a graph is curved, the slope changes from point to point, so one overall rise-over-run value does not describe the motion at a single instant.
To get the slope at one exact time on a curved graph, use a tangent line drawn at that point.
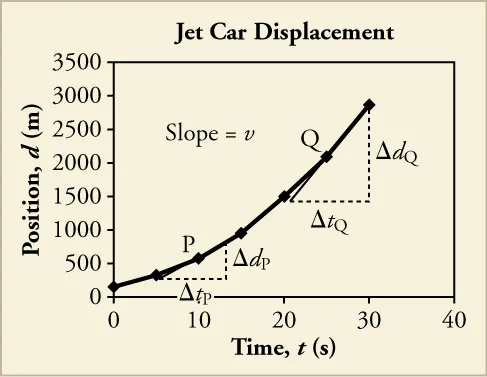
A curved position–time plot with tangent lines drawn at two different instants. The differing tangent slopes illustrate how instantaneous velocity depends on the local steepness of the curve, not on the height (position) of the graph. Source
The tangent captures the graph's local direction at that instant.
Tangent line: A line that matches the graph's instantaneous direction at a single point, allowing the slope at that point to be determined.
A tangent is a local tool. You should choose it based on the behavior of the graph very near the selected time, not by matching points far away on the curve. This is the graphical form of taking a derivative.
Position-time graphs
On a position-time graph, the vertical coordinate tells where the object is, but the slope tells how that position is changing. A high point on the graph does not necessarily mean a high velocity; only the slope gives velocity.
A positive tangent slope means positive velocity. A negative tangent slope means negative velocity. A horizontal tangent means the instantaneous velocity is zero at that moment. A steeper tangent means a greater magnitude of velocity.
= instantaneous velocity in meters per second
= position in meters
= time in seconds
This calculus statement says exactly what the graph shows: the instantaneous velocity is the slope of the tangent to the position-time curve. Even without an equation, you should interpret the tangent slope physically as the velocity at that instant.
Common readings from a position-time graph
A straight line with constant positive slope means constant positive velocity.
A straight line with constant negative slope means constant negative velocity.
A curve whose tangent becomes steeper in the positive direction has increasing velocity.
A curve whose tangent becomes steeper in the negative direction has decreasing velocity.
At a smooth turning point, the tangent is horizontal, so the instantaneous velocity is zero.
Velocity-time graphs
On a velocity-time graph, the vertical value is velocity itself, while the slope represents acceleration.
This is a common source of error: the graph's height tells you velocity, but the graph's steepness tells you acceleration.
A positive slope means positive acceleration. A negative slope means negative acceleration. A horizontal line means zero acceleration, even if the velocity is not zero. A steeper line means a larger magnitude of acceleration.
= instantaneous acceleration in meters per second squared
= velocity in meters per second
= time in seconds
On a curved velocity-time graph, the acceleration changes with time because the slope changes from one point to another. On a straight velocity-time graph, the slope is constant, so the acceleration is constant.
Common readings from a velocity-time graph
An upward-sloping straight line means constant positive acceleration.
A downward-sloping straight line means constant negative acceleration.
A horizontal line above or below the time axis means constant velocity and zero acceleration.
A graph can lie below the time axis and still have positive slope, which means negative velocity but positive acceleration.
Reading graphs with precision
Always identify the axes before interpreting a slope. Two graphs may look identical, but if one plots position against time and the other plots velocity against time, their slopes represent different physical quantities.
When you estimate a tangent from a drawn curve, small drawing errors can change the numerical slope. For that reason, AP Physics C questions often expect careful attention to scale, units, and the exact point where the slope is evaluated.
It is also possible for two different moments to have the same position but different tangent slopes, or the same velocity but different slopes on a velocity-time graph. The graph value and the graph slope answer different questions.
If a graph has a sharp corner, there is no single tangent line at that point. In that case, no unique instantaneous slope can be assigned there from the graph alone.
FAQ
A tangent line only has to match the curve's local direction at the chosen point. On a curved graph, that same line may pass from one side of the curve to the other.
What matters is that the line gives the correct slope at that instant, not that it stays outside the curve everywhere.
Start by drawing a smooth best-fit curve through the data rather than joining every point with sharp segments.
Then:
choose the point of interest
sketch a tangent that follows the curve locally
pick two well-separated points on the tangent line
calculate the slope from those two points
This reduces the effect of random scatter in the measurements.
Slope includes units, so changing the axis units changes the number attached to the same physical rate.
For example, a velocity written in metres per second will have a different numerical value if rewritten in centimetres per second. The motion is identical; only the unit scale has changed.
That is why the units of slope should always be checked alongside the number.
Each graph makes a different feature easier to spot.
A position-time graph is useful for seeing where the object is and when it changes direction.
A velocity-time graph is useful for seeing whether the rate of speeding up or slowing down is changing.
Using both can help you check whether your interpretation of slope is physically consistent.
It depends on the graph scale, the thickness of the printed curve, and how clearly the tangent can be drawn.
A sensible approach is to:
use as large a rise and run as possible on the tangent line
avoid reading from points too close together
keep a reasonable number of significant figures
If the graph is hand-drawn or experimental, a small uncertainty in the slope is normal.
Practice Questions
An object moves along the -axis. At , the tangent to its position-time graph has slope . State the object's instantaneous velocity and direction of motion.
1 mark: States
1 mark: States the object is moving in the negative -direction
A particle's velocity-time graph consists of a straight-line segment from to , followed immediately by a horizontal segment from to . Time is in seconds and velocity is in meters per second.
(a) Determine the acceleration for .
(b) Determine the acceleration for .
(c) Can the instantaneous acceleration at be determined from the graph? Explain.
(a) 1 mark: Uses slope of the velocity-time graph
(a) 1 mark:
(b) 1 mark: States
(c) 1 mark: States that no single instantaneous acceleration can be determined at
(c) 1 mark: Explains that the graph has a corner, so the left-hand and right-hand slopes are different
