
AP Syllabus focus: 'Motion can be represented using motion diagrams, figures, graphs, equations, and narrative descriptions.'
In mechanics, the same motion can be shown in several complementary forms. Learning to translate among them helps you interpret problems, identify patterns, and communicate physical reasoning clearly.
Why Multiple Representations Matter
Motion problems rarely arrive in one perfect form. A verbal statement, sketch, graph, or equation may all describe the same physical event, but each makes different features easier to see. In AP Physics C Mechanics, you should be able to read any of these forms and translate between them without changing the underlying motion. This matters because one representation may clarify direction, another may organize timing, and another may express relationships compactly for analysis. Good physics reasoning often depends on checking whether several representations tell a consistent story about the same object.
A strong representation does not add new physics by itself. Instead, it highlights the physics already present in the motion.
Motion Diagrams
What a Motion Diagram Shows
A motion diagram is often the fastest way to visualize how motion unfolds over time.
Motion diagram: A visual representation of an object's position at successive, usually equal, time intervals, often supplemented with arrows that indicate direction of motion.
In a motion diagram, the spacing between successive positions carries meaning. Larger spacing over equal time intervals indicates greater speed, while decreasing spacing indicates slowing down. A reversal in the pattern shows a change in direction. Because the time intervals are typically equal, the diagram communicates change over time without needing lengthy text.
Motion diagrams are especially useful for comparing different stages of motion at a glance. However, they are only effective when the time step is consistent and the direction of motion is shown clearly. If the spacing or direction is ambiguous, the diagram can mislead rather than clarify.
Figures and Visual Models
A figure is broader than a motion diagram. It usually shows the physical situation: the object's path, the coordinate axes, important positions, and sometimes key instants such as the start and finish. A figure may include labels like origin, positive direction, or position markers. Its job is to organize the geometry of the problem.
A good figure does not need to show every instant of the motion. Instead, it helps identify where the object is, what direction counts as positive, and how different points in space are related. This is particularly helpful when the wording of a problem is dense or when several objects are involved.
Figures are most useful when they are simple, labeled, and physically meaningful. Overcrowded sketches often hide the main idea.
Graphs
How Graphs Organize Motion
A graph represents motion by plotting one quantity against another, most often a motion variable against time. Common physics choices include versus , versus , and versus .
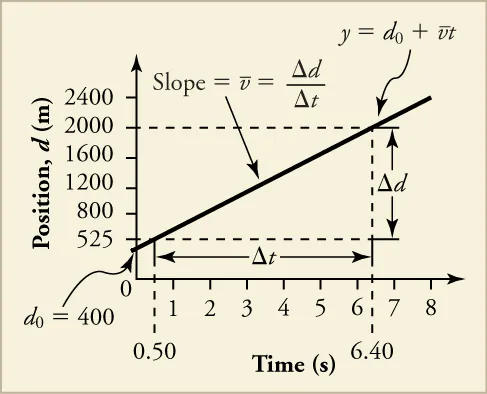
A position-versus-time (–) graph with labeled axes and a slope triangle that visually encodes . It reinforces how the same motion information can be extracted geometrically (slope) rather than only algebraically. The careful labeling models the graph-reading habits expected in AP Physics C. Source
Graphs are powerful because they display patterns continuously rather than as isolated snapshots.
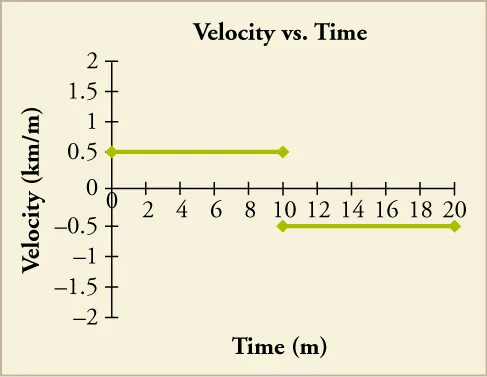
A velocity-versus-time (–) graph with clearly labeled axes, illustrating how constant velocity appears as a horizontal line. It naturally connects graphical features to physics: the slope corresponds to acceleration, and the area under the curve corresponds to displacement. Used alongside an – graph, it highlights translation between representations without changing the underlying motion. Source
A graph can show whether a quantity stays constant, changes steadily, or varies in a more complicated way. It can also highlight intervals where the motion behavior changes. For example, a flat segment, a straight segment, and a curved segment each communicate different kinds of physical behavior.
To read a graph correctly, always check:
what quantity is on each axis
the units and scale
the time interval shown
whether the graph is continuous or piecewise
Graphs are compact and information-rich, but they only work when the axes are labeled carefully and interpreted in context.
Equations as Representations
An equation represents motion symbolically. It states a relationship between variables such as position, velocity, acceleration, and time. In mechanics, expressions like , , or describe how a quantity depends on time.
Equations are useful because they are concise and precise. A single expression can encode starting conditions, direction, and how the motion changes. They also make it possible to compare motion quantitatively and to connect a verbal or graphical description to a mathematical model.
Still, equations can hide the physical picture if read carelessly. A sign, exponent, or constant has meaning only when tied back to the situation being described. For that reason, equations should not be treated as separate from diagrams, figures, or graphs. They are another language for the same motion.
Narrative Descriptions
Using Words Precisely
A narrative description explains motion in words.
Narrative description: A verbal account of how an object's motion changes, including details such as direction, relative speed, and important events or intervals.
Narrative descriptions are often the starting point of a physics problem. They tell you what happens first, what happens next, and which changes are physically important. Phrases such as "moves to the right," "comes to rest," "reverses direction," or "speeds up for two seconds" can all define the motion clearly when used precisely.
Because words can be vague, strong narrative descriptions avoid casual language. They should identify the object, the direction, the time order of events, and any comparisons in speed or location. When written well, a narrative description guides the construction of every other representation.
Translating Between Representations
Success in mechanics depends on moving fluently from one representation to another. A written description can become a figure, a figure can become a graph, and a graph can suggest an equation. If the physics is correct, all of them should agree about the object's direction, timing, and changes in motion.
When translating, focus on:
the initial state
the direction chosen as positive
how the motion changes over time
whether the same intervals and events appear in every form
If two representations seem to disagree, the issue is usually not the motion itself but an error in labeling, sign choice, timing, or interpretation. Treat consistency as a test of understanding, not just presentation.
FAQ
A piecewise representation is better when the motion changes in distinct stages, such as moving, stopping, then reversing direction.
It helps you match each interval to a specific physical event. This is often clearer than forcing one smooth graph or one equation to describe behaviour that is really stage-based.
Changing the scale can make a graph look steeper, flatter, stretched, or compressed, even though the physical motion is unchanged.
That is why you should always inspect the axis labels and numerical spacing. Two graphs can represent the same motion if they preserve the same relationships, even when they look visually different.
A schematic figure is a simplified drawing made to show the essential physics, such as positions, axes, and directions. It leaves out unnecessary visual detail.
A stroboscopic image is based on recorded positions at regular time intervals, often from photography or video. It is closer to experimental evidence, while a schematic figure is a cleaner interpretive model.
Yes. The same motion can be written with different choices of origin, time zero, or coordinate direction.
For instance, one equation may measure position from the left edge of a track, while another measures from the centre. If both are used consistently, they can describe exactly the same physical motion.
First, identify what is missing. Common gaps include the positive direction, the starting location, or whether a phrase refers to speed or velocity.
Then state a reasonable assumption clearly in your sketch or notes. In an exam, a well-labelled assumption is usually better than leaving the representation vague or internally inconsistent.
Practice Questions
A motion diagram shows dots at equal time intervals. The dots lie along a straight line to the right, and the spacing between successive dots increases.
State what this indicates about: (a) the direction of motion (b) the speed of the object
1 mark: The object is moving to the right.
1 mark: The object's speed is increasing.
A cart moves along the -axis. From to s, it moves to the right at constant speed. From s to s, it remains at rest. From s to s, it moves to the left at a constant speed smaller in magnitude than before.
(a) Write a brief narrative description of the motion. (1 mark)
(b) Draw or describe a motion diagram for the cart using equal 1 s time intervals. (2 marks)
(c) Sketch qualitative position-time and velocity-time graphs consistent with the motion. (2 marks)
(a)
1 mark: Describes all three intervals in correct order: moving right at constant speed, then at rest, then moving left at a smaller constant speed.
(b)
1 mark: Motion diagram shows equally spaced positions to the right during the first interval.
1 mark: Motion diagram shows repeated position during the rest interval and then leftward positions with smaller spacing than in the first interval.
(c)
1 mark: Position-time graph has a straight increasing segment, then a horizontal segment, then a straight decreasing segment with smaller magnitude slope.
1 mark: Velocity-time graph has a positive constant segment, then zero, then a negative constant segment with smaller magnitude than the first positive segment.
