
AP Syllabus focus: 'Displacement is the area under a velocity-time graph, and change in velocity is the area under an acceleration-time graph.'
Motion graphs do more than show trends: their enclosed areas represent physical changes. For AP Physics C, interpreting these areas correctly connects graphical information directly to displacement and velocity change.
Interpreting Area on Motion Graphs
When time is on the horizontal axis, the area between the curve and the time axis has physical meaning because the vertical quantity is multiplied by time. On a velocity-time graph, the units of area are , which matches displacement.
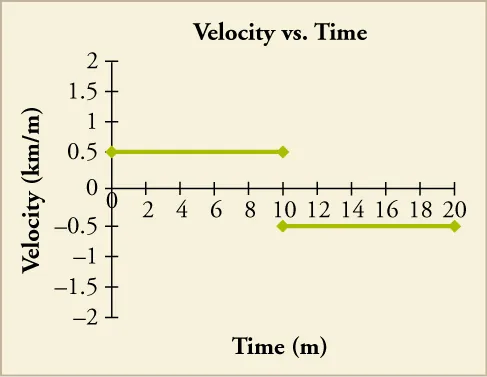
A velocity–time graph with a shaded region representing the displacement over a time interval. The diagram makes the “area under ” idea concrete by tying a geometric area to units of meters and to a net (signed) change in position. Source
On an acceleration-time graph, the units are , which matches change in velocity.
The key idea is not simply geometric area, but signed area.
Signed area: The area between a graph and the time axis, treated as positive when the graph lies above the axis and negative when it lies below the axis.
Signed area matters because motion quantities in this topic are directional. A region below the time axis subtracts from the total rather than adding to it.
= displacement, in meters
= velocity, in meters per second
= initial and final time, in seconds
This equation states that the displacement over a time interval is the signed area under the velocity-time graph during that interval.
Velocity-Time Graphs and Displacement
A velocity-time graph shows how velocity changes as time passes. To find displacement from the graph, identify the regions between the graph and the time axis and add their signed areas.
If the graph is made of straight-line segments, the displacement can often be found by breaking the region into simple shapes:
Rectangles for constant velocity
Triangles for linearly changing velocity starting or ending at zero
Trapezoids for linear changes between two nonzero velocities
Each region must keep its sign:
Area above the axis gives positive displacement
Area below the axis gives negative displacement
Area that crosses the axis must be split into separate pieces before adding
This sign convention is essential. A large positive area followed by an equally large negative area gives zero net displacement, even though the object was moving during the interval. That is why the graph’s area represents displacement, not automatically total path length.
Curved velocity-time graphs follow the same principle. The displacement is still the signed area under the curve, but the area may require calculus rather than simple geometry. On AP Physics C problems, you may be expected to interpret the region qualitatively, calculate it from a known function, or combine several geometric pieces when the graph is piecewise defined.
A useful check is dimensional analysis. If you multiply the vertical axis value, velocity in , by the horizontal axis value, time in , the result is . That agreement of units confirms that the area has the correct physical meaning.
Acceleration-Time Graphs and Change in Velocity
The same graphical idea applies to an acceleration-time graph, but the quantity determined by area is different.
= change in velocity, in meters per second
= acceleration, in meters per second squared
= initial and final time, in seconds
The signed area under an acceleration-time graph gives the change in velocity, not the velocity itself.
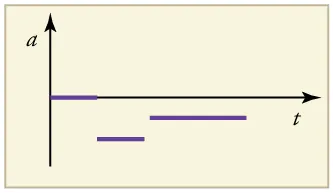
An acceleration–time graph showing piecewise-constant acceleration (including negative acceleration). Interpreting the signed area between the curve and the time axis over each interval gives the net velocity change for that interval. Source
To determine the final velocity, combine that change with the initial velocity.
As with velocity-time graphs, sign matters:
Positive area means velocity changes in the positive direction
Negative area means velocity changes in the negative direction
Areas on opposite sides of the axis can cancel
This cancellation can be physically important.
An object may experience positive acceleration for part of an interval and negative acceleration later, yet the overall change in velocity can still be zero if the signed areas balance.
Do not confuse change in velocity with change in speed. Because velocity includes direction, a positive area on an acceleration-time graph does not always mean the object is speeding up. It means the velocity is being shifted in the positive direction. The actual change in speed depends on the object’s current velocity direction as well as the sign of the area.
For piecewise acceleration graphs, treat each time interval separately and sum the signed areas. For curved acceleration graphs, the same integral interpretation applies. Again, the units provide a quick check: , which matches change in velocity.
Common Interpretation Issues
Several recurring mistakes appear when students use graph areas:
Using the magnitude of every region without preserving signs
Forgetting to split a region where the graph crosses the time axis
Reporting the area under an acceleration-time graph as displacement
Giving the area under a velocity-time graph as final position without accounting for the starting position
Ignoring units, which often reveals the wrong physical quantity
When reading a graph, always ask two questions first:
What quantity is on the vertical axis?
Is the requested result a net change or a value that requires additional information?
That habit helps you connect the graph to the correct physical interpretation. On this subsubtopic, the central rule is precise: area under velocity versus time gives displacement, and area under acceleration versus time gives change in velocity.
FAQ
Use a numerical estimate. The most common method is to divide the interval into narrow strips and approximate each strip as a rectangle or a trapezium.
A trapezium estimate is usually better than a rectangle estimate because it uses both end values of each interval. On an exam, the method matters: label the widths clearly, keep signs, and state that the result is an approximation.
Yes. You cannot simply count boxes or add heights if the widths are different.
For each section, use its own time width:
rectangle: width $\times$ height
triangle: $\dfrac{1}{2}\times base\times height$
trapezium: average height $\times$ width
If the graph uses irregular spacing on the time axis, be especially careful. Two regions with the same height may contribute different amounts because their time intervals are not equal.
A jump means the graph is piecewise, so you should treat the intervals on either side separately.
An open circle at a single instant usually does not affect the total area, because a single point has zero width in time and therefore contributes zero area. What matters is the area over intervals, not the value at one isolated instant.
Still, such features can matter when deciding which formula applies just before or just after the jump.
Yes. The total signed area can match even if the shapes are completely different.
For example:
one graph may have a large value over a short time
another may have a smaller value over a longer time
If the signed areas are equal, the resulting displacement or change in velocity is equal over that interval. This is why area tells you the net effect, not the full story of how the motion unfolded at every moment.
This usually comes from numerical rounding or graph sampling.
Common causes include:
decimal truncation
unequal plotting intervals
approximation by straight segments
limited screen or pixel resolution
In hand-marked physics work, a very small residual such as $0.001$ m/s may reasonably be treated as zero if the exact areas should cancel. Always judge the result against the physical situation and the precision of the data.
Practice Questions
A particle moves along a straight line. Its velocity is m/s from to s. From s to s, the velocity decreases linearly from m/s to m/s.
Determine the displacement of the particle from to s.
1 mark: Correct area from to s, m
1 mark: Correct signed area from to s, m
1 mark: Correct total displacement, m
A particle has the following acceleration as a function of time:
m/s for s
for s
m/s for s
At , the particle’s velocity is m/s.
(a) Using the area under the acceleration-time graph, determine the total change in velocity from to s.
(b) Determine the velocity at s.
(c) At what time does the particle first reach zero velocity?
1 mark: Area from to s gives m/s
1 mark: Area from to s is , and area from to s gives m/s
1 mark: Net change in velocity is m/s
1 mark: Final velocity is m/s
1 mark: To reach zero velocity from m/s, the particle needs m/s; with m/s, this occurs at s
