
AP Syllabus focus: 'In a stem-and-leaf plot, each data value is split into a stem and a leaf, usually using leading and final digits.'
Stem-and-leaf plots organize quantitative data while keeping the original observations visible. They are especially helpful for small to moderate data sets because they show exact values, ordering, and frequency in one compact display.
What a stem-and-leaf plot shows
A stem-and-leaf plot is a graph-like display for quantitative data. Each observation is broken into two parts, and those parts are listed so the data appear in numerical order.
Stem-and-leaf plot: A display for quantitative data in which each observation is separated into a stem and a leaf and then arranged in order.
The main idea is simple: the stem contains the leading digit or digits, and the leaf contains the final digit. This allows the display to organize data without losing the original values. Unlike some graphs, a stem-and-leaf plot lets you recover each observation directly from the plot itself.
Stems and leaves
Stem: The leading digit or digits of a data value used to group observations.
A stem creates the basic structure of the display by collecting values that begin the same way.
Leaf: The final digit of a data value written beside its stem.
The leaf completes the value. For many two-digit whole-number data sets, the tens digit is used as the stem and the ones digit is used as the leaf. The exact split depends on the data, but the rule must stay consistent throughout the entire plot.

This example organizes long-jump distances into stems and leaves, with each leaf representing a single original measurement. It illustrates the convention of sorting leaves within each stem and shows how stem-and-leaf plots can represent decimal data when the place-value key is understood. Source
How to construct a stem-and-leaf plot
A correct stem-and-leaf plot follows a clear process:
Start with a list of quantitative observations.
Decide how each value will be split into a stem and a leaf.
Write the stems in numerical order in a vertical column.
Place each leaf next to the correct stem.
Write the leaves for each stem in ascending order.
Include repeated leaves if a value occurs more than once.
Check that every original observation appears exactly once.
Ordering the leaves is important. A stem-and-leaf plot is not just a storage list; it is meant to show the organized pattern of the data. If the leaves are not sorted, the display is harder to read and less informative.
A reader must also know how to combine a stem and a leaf back into an original value.
Key: A note that shows how one stem-and-leaf entry should be interpreted as a data value.
A key removes ambiguity. Without it, the display may be unclear, especially when the place value is not obvious.
Reading a stem-and-leaf plot
Every leaf represents one observation. If a stem has five leaves, then five data values fall in that group. If the same leaf appears more than once beside a stem, then that exact value occurs more than once in the data set.
Because the values are organized from smallest to largest, the plot gives immediate information about the data set:
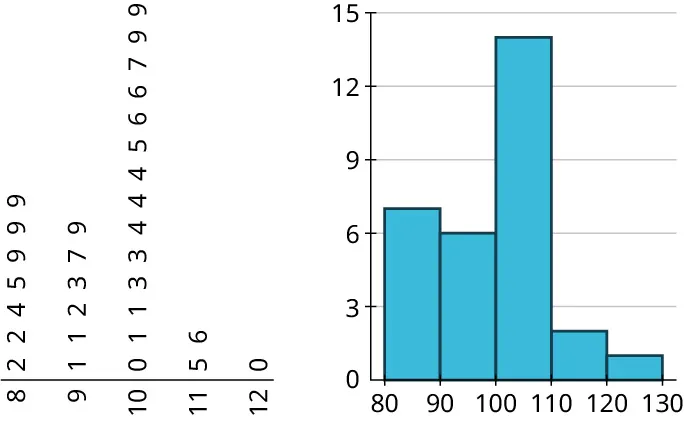
A stem-and-leaf plot is shown next to a histogram built from the same dataset. The side-by-side comparison highlights how the stem-and-leaf plot preserves the original observations, while the histogram emphasizes the overall distribution and bin counts. Source
the smallest and largest values can be identified directly
the number of observations in a stem can be found by counting leaves
repeated values are easy to spot
the data remain visible as individual observations, not just grouped counts
This makes stem-and-leaf plots especially useful when you want both organization and detail. They are more informative than a simple unordered list because they reveal structure, but they still preserve the raw data.
Choosing stems effectively
The way stems are chosen affects how useful the plot will be. A poor choice can make the display crowded or overly spread out.
Good stem choice should create a display that is easy to read:
If there are too few stems, each row may have too many leaves.
If there are too many stems, the plot may look sparse and harder to interpret.
The same stem rule must apply to every value in the data set.
In some cases, one stem may collect too many leaves. Then the stem can be split into two rows, usually one row for smaller leaves and one for larger leaves. This keeps the plot readable while preserving the same basic method of splitting each data value into a stem and a leaf.
A well-designed stem-and-leaf plot balances detail and clarity.
Strengths and limitations
Stem-and-leaf plots have several important strengths:
They preserve the original data values.
They organize observations into numerical order.
They show how often values occur.
They are quick to make by hand for smaller data sets.
They also have limitations:
They become awkward for very large data sets.
They depend heavily on a sensible choice of stems.
They can be confusing if the key is missing.
They are less effective when the data require many digits to be displayed.
Common mistakes to avoid
Using an inconsistent rule for splitting values into stems and leaves
Forgetting to put stems in numerical order
Writing leaves in random order instead of ascending order
Leaving out repeated leaves when values repeat
Counting a stem as one observation instead of counting the leaves
Making the plot without a key, so the values cannot be read unambiguously
Practice Questions
A stem-and-leaf plot uses the key .
One row of the plot is:
a) Write the four data values represented by this row. b) How many observations are represented in this row?
1 mark for identifying the values as 60, 62, 62, and 69
1 mark for stating that there are 4 observations
A teacher records the following quiz scores:
61, 63, 67, 70, 72, 72, 74, 78, 81, 84, 85, 89, 90, 91
Construct a stem-and-leaf plot using the tens digits as stems and the ones digits as leaves. Include a key.
1 mark for listing the stems correctly as 6, 7, 8, and 9
2 marks for placing all leaves with the correct stems
1 mark for ordering the leaves within each stem
1 mark for showing the repeated value 72 with two leaves of 2 in the 7 stem
1 mark for including a correct key such as
FAQ
Choose a place value before you begin, and use it consistently.
For example:
stems might represent whole numbers and leaves might represent tenths
or stems might represent tenths and leaves might represent hundredths
The key becomes especially important. A clear key tells the reader exactly how to rebuild each decimal value.
Negative values can be included, but you must keep the ordering correct.
A common approach is:
list the negative stems first
then zero if needed
then the positive stems
Be careful with the leaves so that the reconstructed values stay in numerical order. A key is essential because negative stem plots are easier to misread.
A back-to-back stem-and-leaf plot places one data set on the left of the stems and another on the right.
This lets you compare two groups using the same stem values. The stems stay in the center, and the leaves extend outward in opposite directions.
It is useful when both groups are measured on the same numerical scale.
Sometimes yes.
Including an empty stem can make the scale easier to follow and can show that no observations fall in that part of the data. This is especially helpful when the stems would otherwise jump abruptly.
However, if too many empty stems appear, the plot may become stretched and harder to read.
Only if the instructions or the context justify rounding.
Rounding can simplify the display, but it also changes the original data values. Since a stem-and-leaf plot is valued for preserving the data, unnecessary rounding reduces one of its main advantages.
If values are rounded, say so clearly and use a key that matches the rounded scale.
