
AP Syllabus focus: 'A discrete variable takes a countable number of values. A continuous variable takes infinitely many values that cannot be counted.'
Understanding whether a quantitative variable is discrete or continuous helps you interpret data correctly, describe possible values, and use language that matches whether the variable is produced by counting or measuring.
Quantitative Variables and Why Type Matters
A quantitative variable records a numerical amount for each individual or case in a data set.
Quantitative variable: A variable whose values are numerical and represent counts or measurements.
Once a variable is quantitative, a key next step is deciding whether it is discrete or continuous.
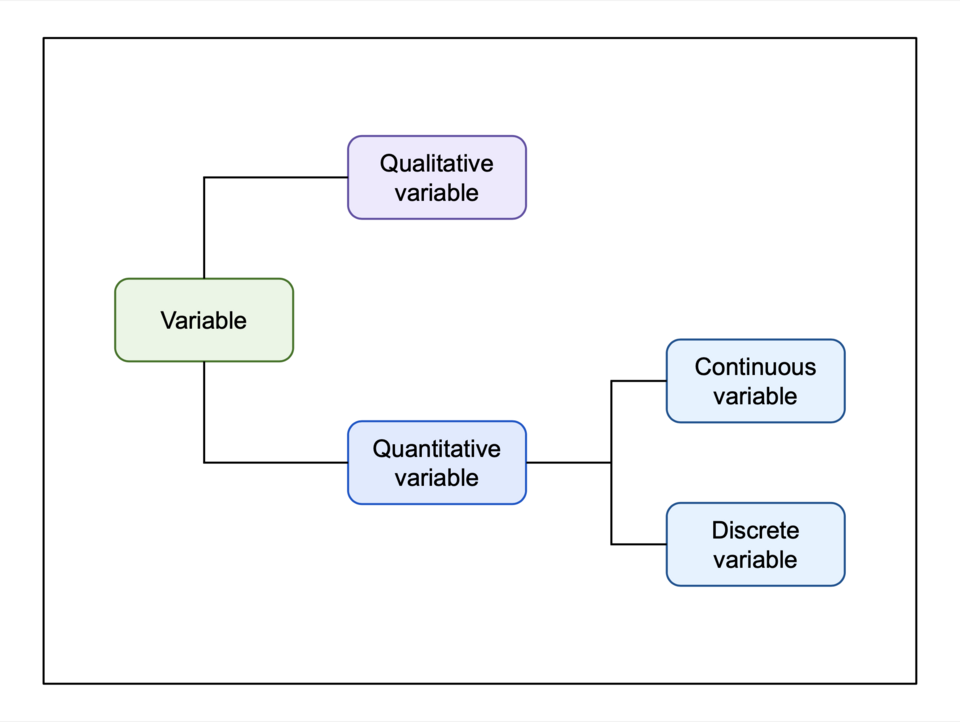
This diagram situates discrete and continuous variables as two subtypes of quantitative (numerical) variables. It helps reinforce that the discrete/continuous decision is a classification step within quantitative data, not a separate kind of data altogether. Source
This distinction is about the set of possible values the variable can take, not just the way the numbers happen to be written in a particular data set. In AP Statistics, this classification helps you describe data accurately and avoid making incorrect claims about what values are possible.
Discrete Quantitative Variables
A discrete variable is a quantitative variable with separated, countable possible values.
Discrete variable: A quantitative variable that takes a countable number of possible values.
Discrete variables usually come from counting. If you count something, the possible values are individual outcomes rather than every point on a number line. Common examples include:
number of siblings
number of cars in a household
number of goals scored
number of students absent
These values are often whole numbers because counts usually increase by one unit at a time. For many discrete variables, values between two consecutive counts do not make sense in context. For example, if a variable counts the number of pets a family owns, a value such as 2.4 is not possible.
A discrete variable may have many possible values, but they are still countable. Even if the list is long, you can imagine listing the possible outcomes one by one.
Continuous Quantitative Variables
A continuous variable is a quantitative variable that can take any value in an interval, at least in principle.
Continuous variable: A quantitative variable that takes infinitely many possible values that cannot be counted.
Continuous variables usually come from measuring. Measured quantities can often be expressed with increasing precision, so there are more and more possible values between any two values. Common examples include:
height
weight
time
temperature
distance
concentration
For a continuous variable, values between two nearby measurements usually do make sense. If one person’s running time is 12.4 seconds and another’s is 12.5 seconds, many values are possible between them, such as 12.41, 12.417, or 12.499 seconds.
In practice, data on continuous variables are often rounded because of measuring tools or recording conventions. That does not make the variable discrete. A height recorded as 68 inches may really represent a measured value somewhere near 68 inches, and many values were possible before rounding.
Key Distinctions
Counting versus measuring
A useful first question is: was the variable created by counting or by measuring?
Counting usually leads to a discrete variable.
Measuring usually leads to a continuous variable.
This rule works well in many settings, although you should still think about the context before deciding.
Possible values
The main difference is the nature of the possible values:
Discrete: separate values with gaps between allowable outcomes
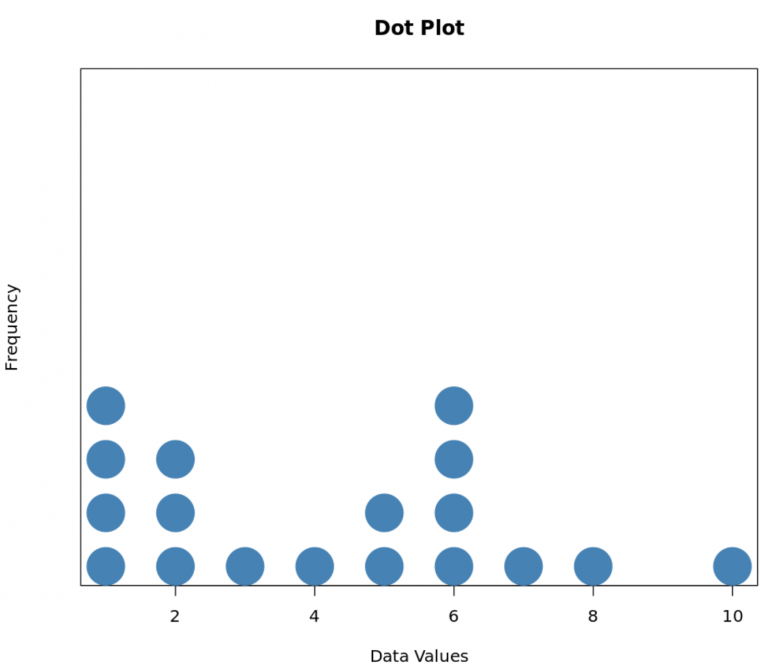
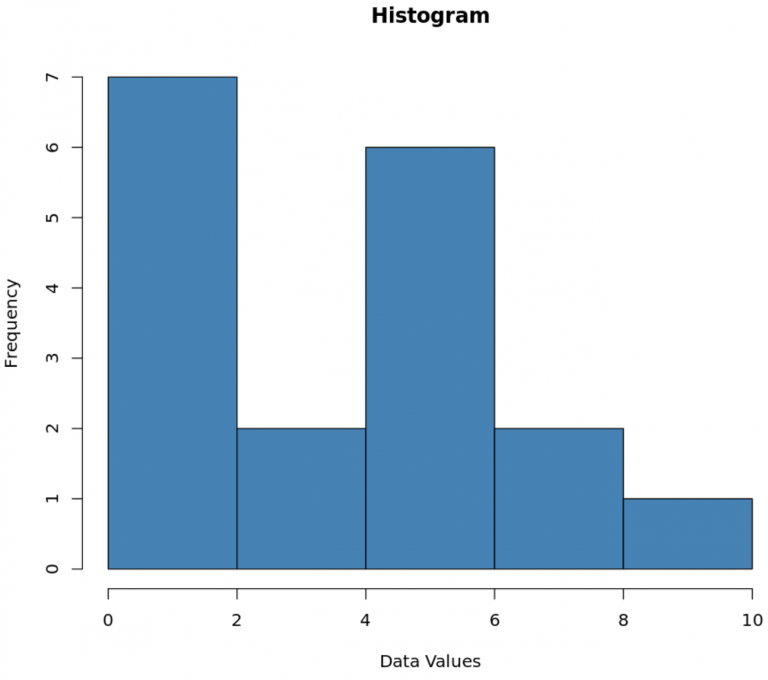
The dot plot displays individual observed values as stacked points, emphasizing separated outcomes typical of discrete data. The histogram groups values into contiguous intervals (bins), illustrating how continuous data are commonly summarized over ranges rather than as isolated points. Source
Continuous: infinitely many possible values in intervals
This means the distinction is not about whether a number has a decimal point. A decimal does not automatically mean continuous, and a whole number does not automatically mean discrete.
Countable versus uncountable possibilities
For a discrete variable, the possible values can be counted. You may be able to list them exactly, or at least imagine listing them in order.
For a continuous variable, the possible values are so dense that they cannot be counted one by one. Between any two possible values, there are more possible values.
How to Classify a Variable in Context
When deciding whether a quantitative variable is discrete or continuous, ask:
Is the variable based on a count or a measurement?
Are values between two nearby numbers meaningful in context?
Could the variable, in principle, take infinitely many values in an interval?
A strong AP Statistics response should use context-based language. Instead of only saying “discrete” or “continuous,” explain why. For example:
“This variable is discrete because it counts the number of events.”
“This variable is continuous because it measures a quantity that can take many values between any two points.”
Common Misclassifications
One common mistake is assuming that all numerical data with decimals are continuous. Some variables can be reported with decimals for convenience, but still come from a count-based process.
Another common mistake is assuming that any data recorded as whole numbers are discrete. A measured variable may be rounded to the nearest unit, even though the underlying quantity is continuous.
A third mistake is thinking that a large number of possible values makes a variable continuous. Size alone does not determine type. A variable can have many possible countable values and still be discrete.
The most reliable approach is to focus on the kind of quantity being recorded and the set of possible values allowed by the context.
Practice Questions
A school records the following two variables for each student:
number of AP courses taken
time spent traveling to school each morning
Classify each variable as discrete or continuous.
1 mark for identifying number of AP courses taken as discrete
1 mark for identifying time spent traveling to school each morning as continuous
A wildlife researcher studies a group of foxes and records these variables: (a) number of pups in each litter (b) body temperature of each fox (c) number of ticks found on each fox (d) length of each fox’s tail
For each variable, state whether it is discrete or continuous and justify your answer in context.
1 mark for (a) discrete with justification that litter size is a count
1 mark for (b) continuous with justification that temperature is measured and can take many values in an interval
1 mark for (c) discrete with justification that number of ticks is a count
1 mark for (d) continuous with justification that tail length is measured and can take many values in an interval
1 mark for using context-based explanations rather than only listing labels
FAQ
Yes. That often happens because measurements are rounded or truncated.
For example, a hospital may record weight to the nearest pound or age to the nearest year. The stored values look discrete, but the underlying quantities are still continuous because more precise values were possible before rounding.
The key question is not how the number was written down, but what type of quantity was being measured.
It depends on what the percentage represents.
If it comes from a measured proportion that could, in principle, vary across many values, it is often treated as continuous.
If it comes from a fixed count out of a small number of trials, only certain percentage values are possible, so it is discrete.
For example, a score of correct answers out of 20 questions can only produce specific percentages, not every value from 0 to 100.
In many real-world settings, money is treated as discrete because currency has smallest units such as cents.
That means not every value is possible; amounts usually change in steps of $0.01.
However, in theoretical modeling or large-scale financial calculations, people sometimes treat money as approximately continuous because the unit size is very small relative to the amounts being studied.
So the classification can depend on how precise the context needs to be.
Usually, yes, because time is a measured quantity and can be divided into smaller and smaller parts.
However, if a study defines time in fixed categories or records only counts of time units, the recorded variable may behave differently from the underlying concept.
For AP Statistics classification, elapsed time itself is generally considered continuous, even if it is rounded to seconds or minutes in the data set.
This is usually done for convenience when the discrete variable has many possible values and the gaps between them are small relative to the scale of the data.
In those cases, a continuous model can be a good approximation and may simplify analysis.
This does not change the true classification of the variable. A count remains discrete even if a later model treats it approximately as continuous. The classification comes from the possible values, not from the method used afterward.
