
AP Syllabus focus: 'An explanatory variable has values used to explain or predict corresponding values of a response variable in a two-variable quantitative relationship.'
When two quantitative variables are recorded for each individual, one key decision is which variable helps explain the other. That choice determines how the relationship is described, displayed, and interpreted in AP Statistics.
Understanding the roles of the variables
In a two-variable quantitative study, an explanatory variable is the variable used as the starting point for explanation or prediction.
Explanatory variable: The variable whose values are used to explain or predict corresponding values of another variable in a two-variable quantitative relationship.
Once that role is identified, the second variable is the response variable, because its values are interpreted in relation to the explanatory variable.
Response variable: The variable whose values are explained or predicted from the values of an explanatory variable.
These roles matter because each individual in the data set contributes a matched pair of numerical values. The two values must belong to the same person, object, or observational unit. If that pairing is lost, the relationship cannot be interpreted correctly. In AP Statistics, the explanatory variable is often labeled x and the response variable y, but the letters are less important than the context of the investigation.
Why these names are important
The names are not just labels. They describe the direction of statistical thinking. With an explanatory variable, you begin with its values and ask how they relate to values of the response variable. With a response variable, you focus on the outcome, measurement, or result that is being explained.
This means that the two variables do not play interchangeable roles in a given analysis. Even if the same paired data are used, the statistical question determines which variable is doing the explaining and which variable is being treated as the outcome.
How to identify the explanatory and response variables
To assign the roles correctly, start with the research question rather than the order of the columns in the data set. Ask what the study is trying to explain or predict.
Useful questions include:
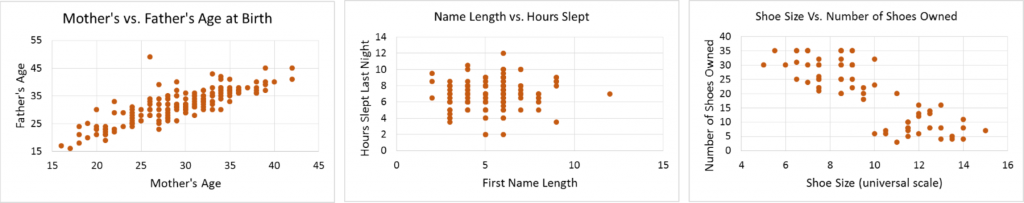
Three example scatterplots that illustrate how two quantitative variables are paired and plotted to study association. Because the axes are explicitly labeled in each panel, the graphic supports deciding which variable is treated as the explanatory (predictor/input) variable and which is treated as the response (outcome) variable in a given study. Source
Which variable is being used to explain differences in the other variable?
Which variable would be known first if a prediction were made?
Which variable acts like an input, condition, or prior measurement?
Which variable represents the outcome you want to understand?
If one variable naturally comes earlier in time and the other is measured afterward, the earlier variable is often the explanatory variable. For example, age, dosage, study time, or temperature are often used to help explain later outcomes. The response variable is usually the result, performance measure, or other outcome of interest.
Context matters more than position
A variable is not automatically explanatory because it appears first in a sentence, first in a spreadsheet, or first alphabetically. It also is not chosen simply because it seems more important. The key question is whether its values are being used to explain or predict the values of the other variable.
In some studies, the researcher may choose or set the explanatory variable directly. In other studies, both variables are simply observed. Either way, a variable can still be explanatory if it is the one used to account for variation in the response.
Why the distinction matters in analysis
Assigning the roles clearly affects how the relationship is presented.
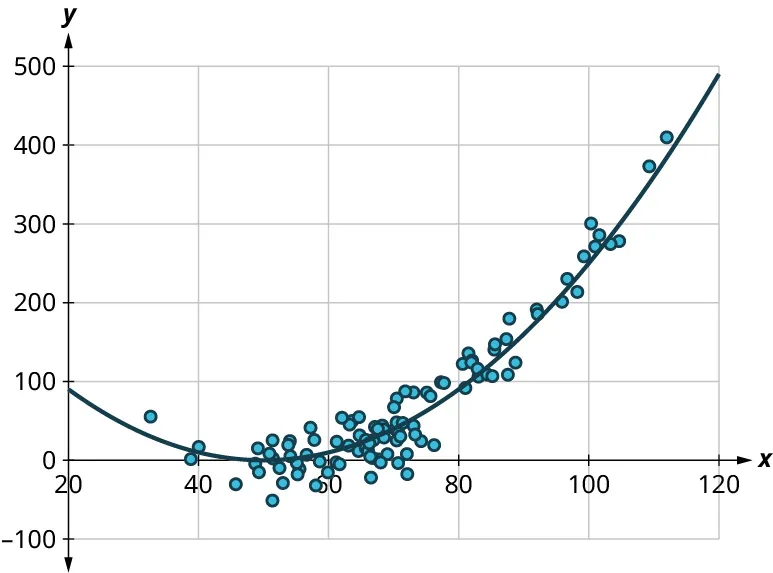
A labeled scatterplot showing how variable roles determine graph placement: the explanatory variable is plotted on the horizontal axis and the response variable on the vertical axis. Each point represents one observational unit’s matched pair , reinforcing that the relationship is interpreted through these paired values. Source
The explanatory variable is placed on the horizontal axis of a graph, and the response variable is placed on the vertical axis. This reflects the idea that response values are examined in relation to explanatory values.
Clear variable roles also improve written interpretation. Statistical statements should describe how the response variable changes as the explanatory variable changes, or how response values may be predicted from explanatory values. Without that direction, descriptions become vague and may fail to answer the actual question being studied.
The distinction also helps keep statistical communication consistent. Once one variable has been chosen as explanatory and the other as response, those roles should remain fixed throughout the discussion. Switching them midway makes labels, interpretations, and predictions unclear, even when the same data pairs are being used.
Language that matches the roles
Good statistical writing uses language that reflects the direction of the relationship. Phrases such as “use one variable to predict the other”, “the response variable changes as the explanatory variable changes”, and “the explanatory variable helps account for variation in the response” are precise and appropriate.
Careful wording is especially important in AP Statistics because correct interpretation depends on identifying which variable is playing which role.
What an explanatory variable does not guarantee
Calling a variable explanatory does not automatically prove that it causes the response. A variable can be useful for explanation or prediction without being the true cause of what is observed. The term tells you the role the variable plays in the analysis, not whether a cause-and-effect claim has been established.
Also, not every pair of quantitative variables has one perfectly obvious direction. In some settings, the most sensible choice depends on the exact statistical purpose. When that happens, the role assignment should be stated clearly before any interpretation is made.
Common mistakes
Assuming the explanatory variable must be the cause.
Choosing the response variable only because it sounds more interesting.
Letting the order of the data file determine the roles.
Forgetting that both variables in this setting are quantitative.
Switching the labels after the graph or analysis has already been described.
Quick check before moving on
Identify the outcome you want to understand.
Decide which variable’s values will be used to explain or predict that outcome.
Make sure the choice fits the context of the study.
Keep the roles consistent in graphs and interpretation.
Practice Questions
A researcher records the number of hours a student studies in a week and that student’s quiz score. Identify the explanatory variable and the response variable.
1 mark: Identifies hours studied as the explanatory variable.
1 mark: Identifies quiz score as the response variable.
A school counselor records the number of hours of sleep students got the night before a test and their test scores.
(a) Identify the explanatory variable and the response variable.
(b) Explain why your choice makes sense in context.
(c) State which variable should be placed on the horizontal axis of a scatterplot and which should be placed on the vertical axis.
(d) Explain why the roles of the variables should stay the same throughout the analysis.
1 mark: Identifies hours of sleep as the explanatory variable.
1 mark: Identifies test score as the response variable.
1 mark: Explains that hours of sleep are being used to explain or predict test performance.
1 mark: States that hours of sleep go on the horizontal axis and test score goes on the vertical axis.
1 mark: Explains that keeping the roles fixed makes labels, interpretations, and predictions consistent and clear.
FAQ
“Response variable” emphasizes the statistical role of the variable in the relationship: it is the variable being explained or predicted.
“Dependent variable” is common in algebra and some sciences, but it can suggest a stronger or more formal dependence than the data alone may justify. AP Statistics usually prefers language tied directly to the purpose of the analysis.
Not always, but it often is. Time is commonly used as an explanatory variable when one measurement is observed at different moments and the goal is to see how the response changes over time.
However, time is only explanatory if it is actually being used to explain or predict the other variable. If the study question is about something else, time may just be background information.
Yes, sometimes. If one variable is measured much more reliably than the other, researchers may prefer to use the more stable measurement as the explanatory variable.
That does not automatically settle the choice, though. The study question still comes first. Measurement quality is a practical consideration, not the only rule.
They may be asking different questions. One researcher may want prediction, while another may want to describe how an outcome changes under a particular condition.
Different subject-matter goals can lead to different role assignments, even when the same variables appear in the data set. The important point is that each choice must be justified by context.
Yes. A single outcome can often be related to several possible explanatory variables.
In this part of AP Statistics, the focus is on identifying one explanatory variable and one response variable in a two-variable relationship. Later statistical methods can handle several explanatory variables at once, but the core idea stays the same: explanatory variables are used to account for or predict the response.
