
AP Syllabus focus:
‘This section introduces the concept of correlation (r) as a statistical measure that quantifies the direction and strength of the linear association between two quantitative variables. It explains that the correlation coefficient, r, ranges from -1 to 1, where values close to 1 or -1 indicate a strong linear relationship, and a value of 0 indicates no linear relationship.’
Correlation provides a structured way to measure how two quantitative variables move together. Understanding this measure helps students interpret linear associations accurately and avoid common misinterpretations in data analysis.
Understanding Correlation
Correlation is a foundational tool in analyzing relationships between two quantitative variables, offering a numerical summary of how strongly and in what direction the variables are linearly associated. When examining data patterns, it is important to remember that correlation describes linear association only, not whether one variable causes changes in another. The correlation coefficient, denoted by r, is a unit-free numerical measure ranging from –1 to 1, providing an essential benchmark for interpreting linear relationships.
The Purpose of Correlation
Correlation helps quantify how closely data points fall along a straight-line trend. When analyzing bivariate quantitative data, the goal is often to detect whether increases in one variable tend to coincide with increases or decreases in another. The correlation coefficient condenses this pattern into a single value, capturing both direction and strength.
Direction of Linear Association
The direction of an association refers to whether variables move together or in opposite ways.
To distinguish this concept clearly, the term positive association is introduced when higher values of one variable correspond to higher values of the other.
Positive Association: A relationship in which increases in one variable tend to accompany increases in the other variable.
Conversely, the term negative association describes situations where increases in one variable correspond to decreases in the other.
Negative Association: A relationship in which increases in one variable tend to accompany decreases in the other variable.
The correlation coefficient captures direction through the sign of r, emphasizing whether the linear trend slopes upward or downward.
Strength of Linear Association
The strength of an association refers to how closely the data align with a straight-line form.
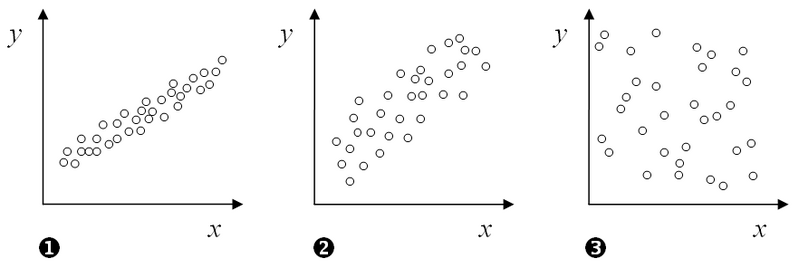
This figure compares scatterplots that display strong, weak, and no linear correlation between two quantitative variables. In the strong case, points lie close to an implied straight line; in the weak case, they are more widely scattered but still trend together. In the “no correlation” panel, there is no visible linear trend, illustrating that the correlation coefficient r would be close to 0. Source.
Values of r near 1 or –1 signal a strong linear relationship, while values near 0 signal a weak or nonexistent linear relationship. Between these extremes lies a continuum in which strength must be evaluated with care, especially when interpreting real-world data that rarely exhibit perfect alignment.
A crucial point is that strength only refers to linearity, not other types of patterns. A dataset may exhibit a strong curved pattern but still have a correlation coefficient close to zero because correlation ignores nonlinear structure.
Numerical Range and Interpretation of r
The range of the correlation coefficient, –1 ≤ r ≤ 1, provides a standardized scale:
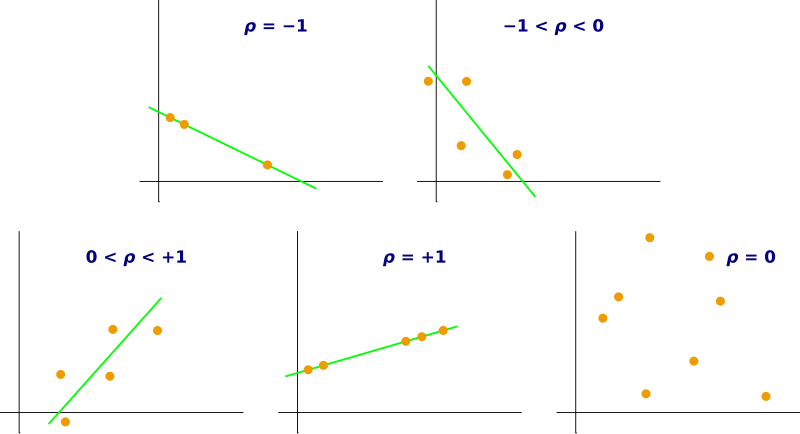
This figure shows example scatterplots for several values of the correlation coefficient, from strong negative to strong positive, including values near 0. As ρ moves away from 0 in either direction, points cluster more tightly around an implied straight line, indicating a stronger linear relationship. This visual reinforces that r measures both the direction and strength of linear association on a fixed scale from –1 to 1. Source.
r = 1 indicates a perfect positive linear relationship.
r = –1 indicates a perfect negative linear relationship.
r = 0 indicates no linear relationship between the variables.
These benchmarks help students judge the clarity of the linear trend displayed in a scatterplot. While perfect correlations are rare in real data, values approaching ±1 still indicate strong and consistent linear patterns.
Requirements and Properties of the Correlation Coefficient
The correlation coefficient possesses several significant properties that shape how it should be interpreted:
Unit-free: Because it uses standardized values, r has no units and remains unaffected by measurement scales.
Resistant to linear transformations: Changing units or shifting measurement origin does not alter correlation.
Sensitive to outliers: Extreme values can dramatically influence the magnitude and direction of r, potentially masking or exaggerating true relationships.
Describes only linear patterns: If the underlying relationship is curved, correlation may misrepresent its strength.
Because of these properties, students must always pair numerical correlation assessments with contextual understanding, recognizing when the value of r may be misleading.
Mathematical Expression of Correlation
Although technology is typically used to calculate correlation, it is appropriate for AP Statistics students to recognize the general structure of the formula.
EQUATION
= Observed variable values
= Means of the variables
This expression highlights that correlation is based on standardized deviations, reinforcing its interpretation as a unit-free measure. Students are not required to compute r by hand but should understand the conceptual basis behind the formula.
Recognizing the Limits of Correlation
Correlation, despite its usefulness, has important limitations. Most notably, correlation does not imply causation. Even a strong value of r cannot establish that changes in one variable cause changes in another. External variables, lurking causes, or pure coincidence may underlie an observed association.
Additionally, correlation cannot diagnose whether a linear model appropriately fits the data. A high r value does not guarantee that the relationship is truly linear; visual inspection through scatterplots remains essential.
A dataset may exhibit a strong curved pattern but still have a correlation coefficient close to zero because correlation ignores nonlinear structure.
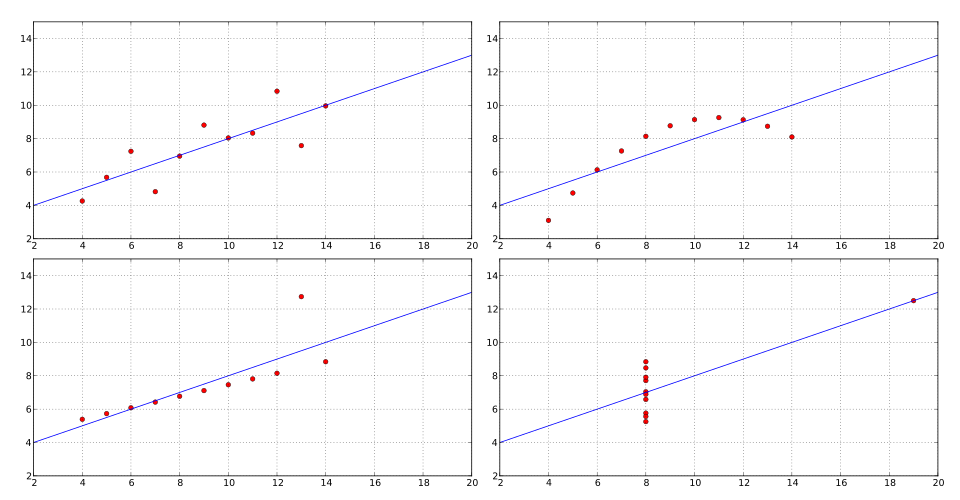
This figure presents four scatterplots, each with nearly the same correlation coefficient and regression line, yet very different shapes and point patterns. One plot follows a linear pattern, another is distinctly curved, another appears linear but is dominated by an outlier, and the last displays a single influential point. The additional structures demonstrate that correlation alone cannot fully describe the relationship or determine whether a linear model is appropriate. Source.
FAQ
Repeated values do not inherently distort correlation, as r is based on standardised deviations rather than ranks. However, ties can reduce the spread of the data, which may weaken the apparent linear association.
If many observations share the same x or y value, the data may form vertical or horizontal clusters, making visual interpretation more difficult even when r remains unaffected.
Correlation summarises only the linear strength and direction, not the shape, spread, or clustering of the data.
Different datasets can produce the same r because:
• Outliers can inflate or deflate correlation.
• Non-linear structures may still produce moderate r values.
• Clusters or subgroups within a dataset may mask distinct patterns.
No. Correlation uses standardised units, so multiplying a variable by a constant or shifting its scale does not change r.
Large differences in measurement units may still mislead interpretation visually, making a scatterplot appear stretched or compressed even though the correlation remains the same.
It can, but the result may be misleading. Restricting the range, such as sampling only high-achieving students, reduces variation in one or both variables.
This often weakens correlation artificially because the reduced variability conceals the true relationship in the wider population.
Measurement error typically reduces the magnitude of r by adding random noise to the data.
If the error is systematic, such as consistently over-reporting a value, correlation may remain largely unchanged because the linear pattern is preserved, even if the data are biased.
Practice Questions
Question 1 (1–3 marks)
A researcher records the heights and arm spans of 20 students and finds that the correlation coefficient r between the two variables is 0.82.
(a) State the direction of the linear relationship.
(b) Comment on the strength of the linear association.
(c) Explain whether this value of r implies that height causes changes in arm span.
Question 1
(a) 1 mark: States the direction is positive.
(b) 1 mark: Identifies the strength as strong or fairly strong.
(c) 1 mark: States correctly that correlation does not imply causation and explains that r does not establish that height causes changes in arm span.
Total: 3 marks
Question 2 (4–6 marks)
A study investigates the relationship between the number of hours spent revising and the score achieved on a statistics test for 30 pupils. The correlation coefficient between revision hours and test score is found to be 0.12.
(a) Interpret the value of r in context.
(b) Explain why a scatterplot would be helpful before drawing conclusions about the relationship.
(c) Suggest one reason why the correlation might be close to zero even if a relationship exists between revision hours and performance.
Question 2
(a) 1–2 marks:
• 1 mark for stating that the linear relationship is very weak or close to zero.
• 1 mark for interpreting that revision hours provide almost no linear predictive power for test score.
(b) 1–2 marks:
• 1 mark for explaining that a scatterplot shows the pattern of data.
• 1 mark for noting that correlation only measures linear association, so a non-linear pattern might still exist.
(c) 1–2 marks:
• 1 mark for giving a valid reason (e.g., presence of outliers, non-linear relationship, restricted range of values).
• 1 mark for contextual explanation of how that reason could reduce the correlation.
Total: 6 marks
