
AP Syllabus focus:
‘Explanation of outliers in the context of regression analysis, characterized by a significant deviation from the general trend and possessing a large residual in relation to the Least Squares Regression Line (LSRL). The discussion will include methods for identifying outliers and their impact on regression analysis.’
Outliers in regression can substantially distort interpretations of relationships between variables. Understanding how to identify and evaluate these unusual points is essential for assessing model accuracy and reliability.
Identifying Outliers in Regression
Outliers in regression appear when an individual data point deviates markedly from the overall pattern of the data, particularly relative to the Least Squares Regression Line (LSRL). In regression contexts, these observations stand apart because their associated residuals, or differences between observed and predicted values, are unusually large. Detecting and understanding these points is essential for evaluating the validity of a regression model and ensuring that interpretations of trends are not misleading.
When analyzing two-variable quantitative data, students must recognize not only the existence of variation but also circumstances in which a specific point lies far from the linear trend. This subsubtopic emphasizes careful inspection of the residual’s magnitude and the influence an extreme point may exert on the model.
Understanding Outliers in Regression
An outlier in regression is a point that does not follow the general linear trend of the remaining data. It is typically identified through the size of its residual. A residual represents the difference between an observed response value and the predicted response from the regression line.
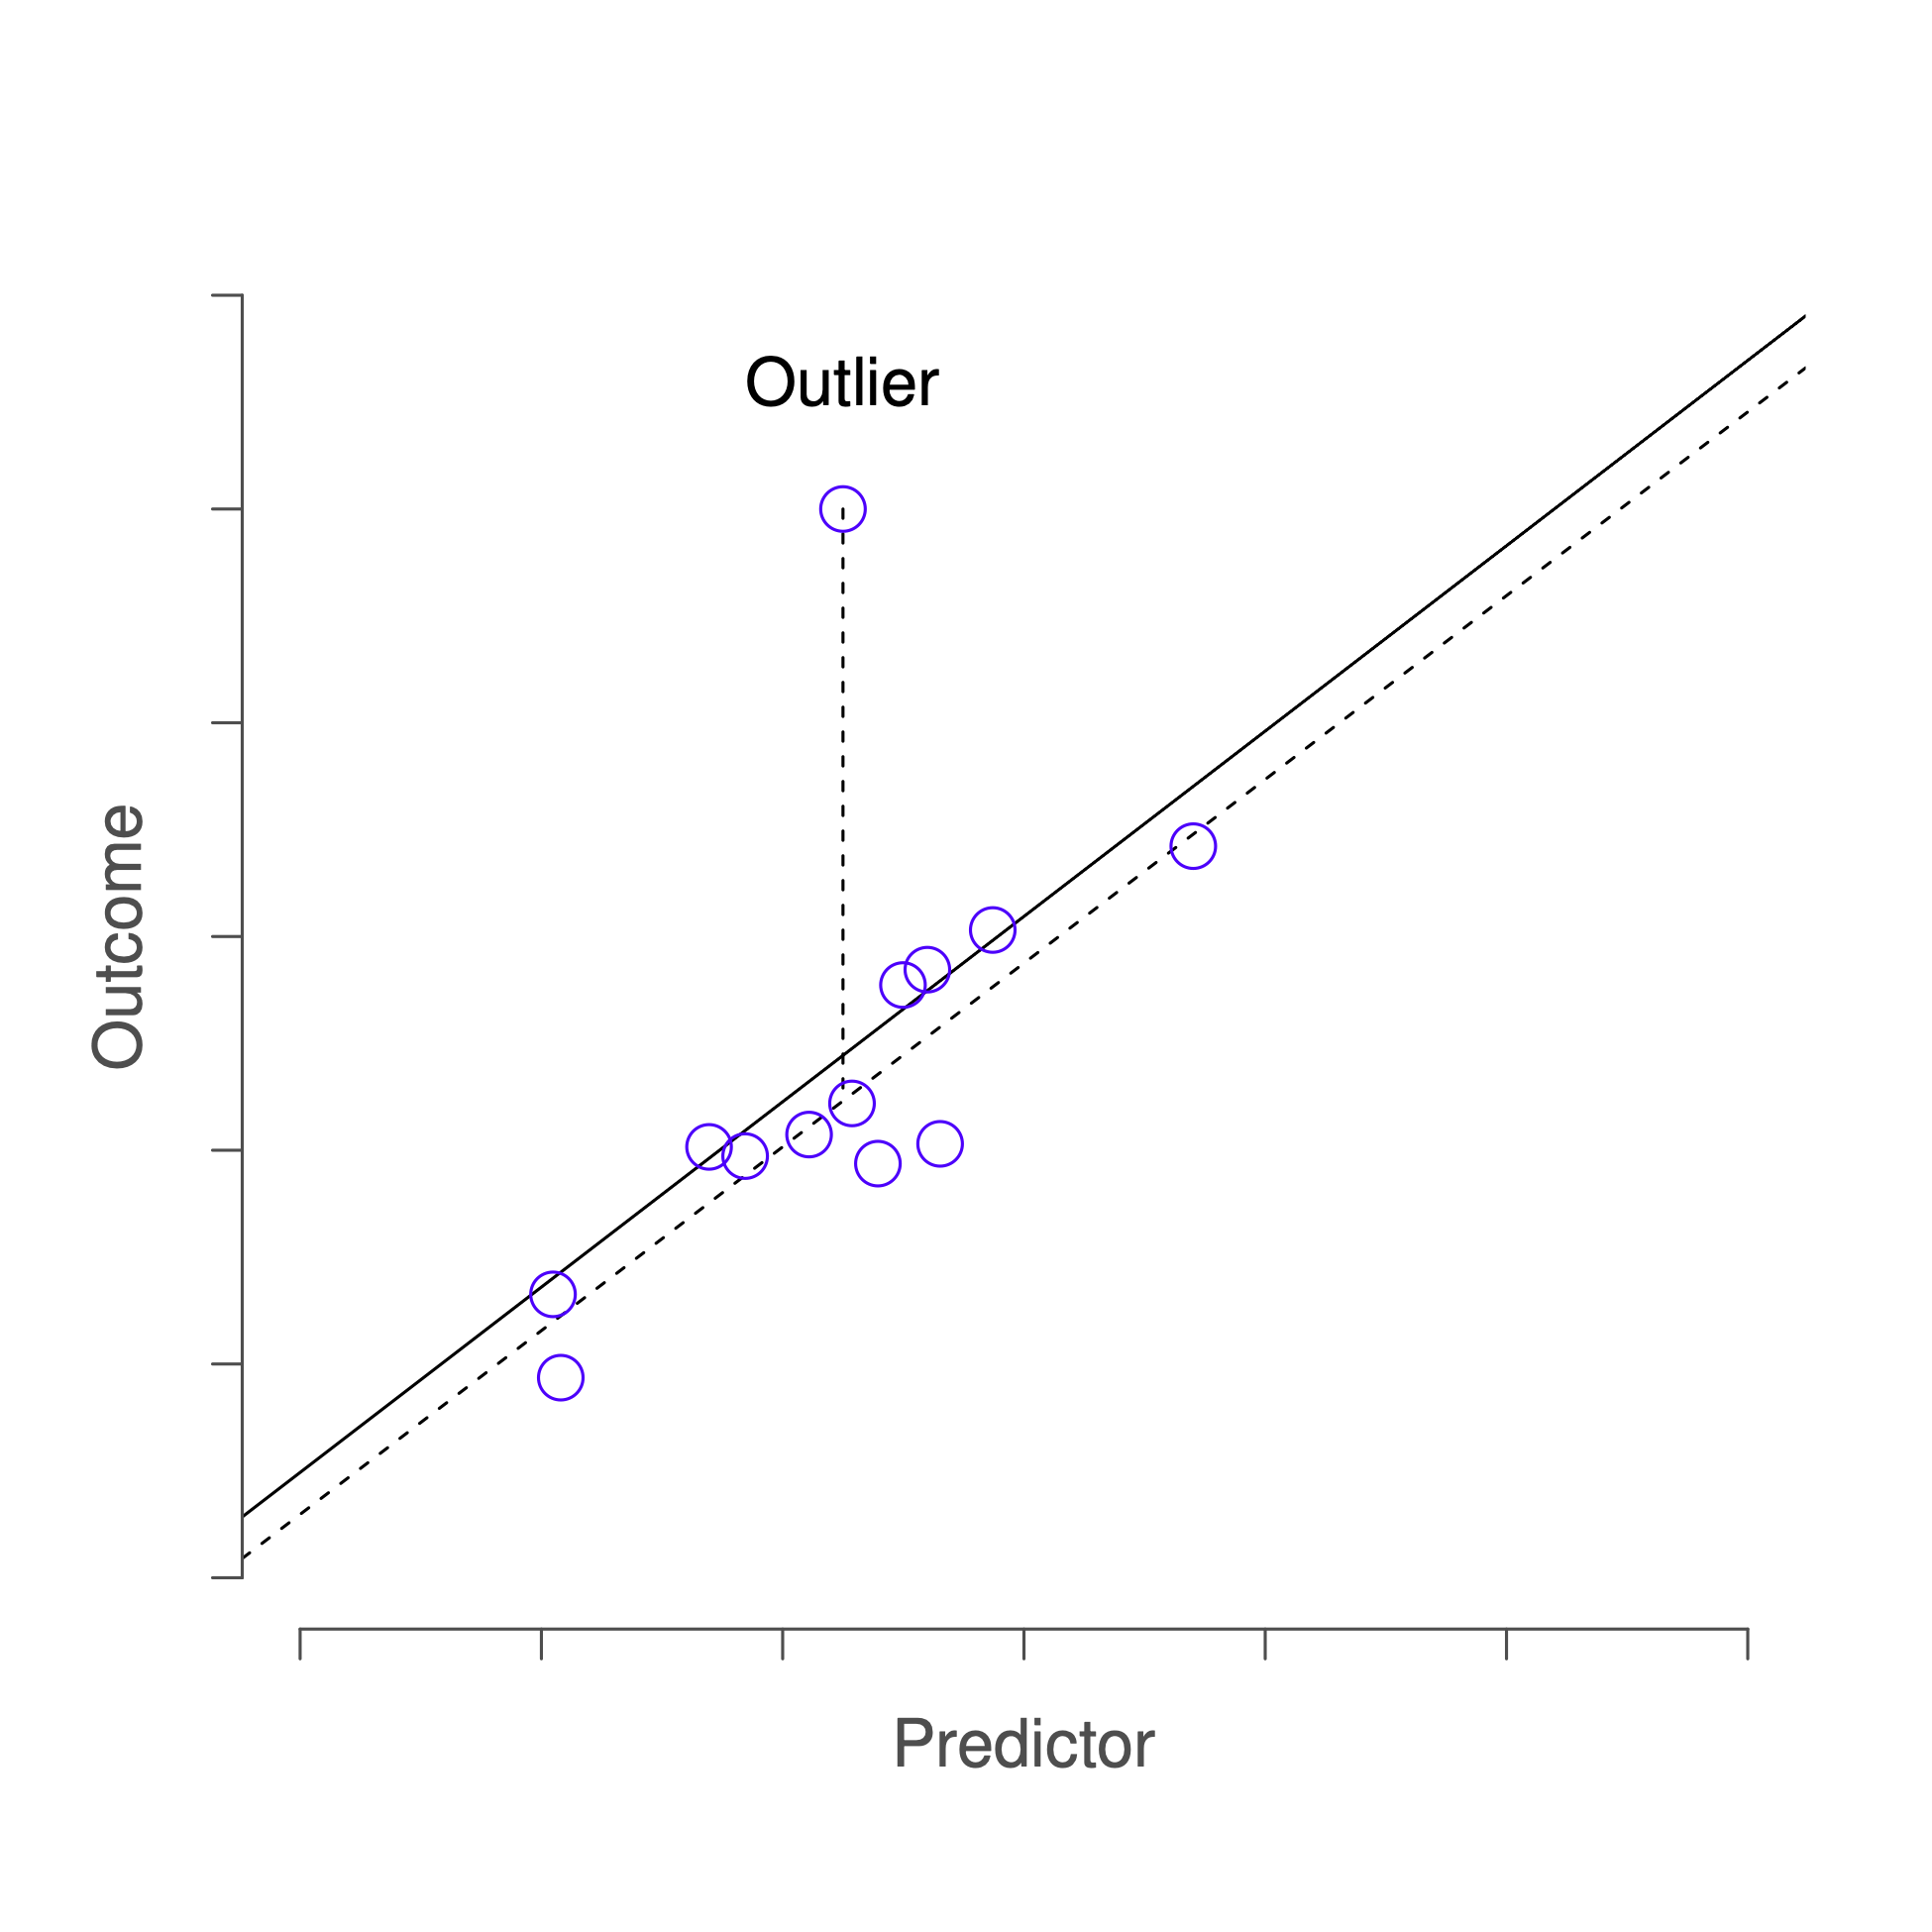
Scatterplot showing an outlier far from the main trend, with solid and dashed regression lines illustrating how a single anomalous point can alter the fitted model. Source.
Outlier (Regression): A data point that shows a large deviation from the overall pattern of the data and has a substantially large residual relative to the LSRL.
Outliers may arise for many reasons, including data recording errors, rare conditions, or natural variability. Regardless of the cause, detecting them is vital because their presence can compromise the predictive utility of a regression model.
Before proceeding to more formal identification methods, it is important to remember that outliers in regression are evaluated within the structure of the linear model itself. An extreme value in the response variable does not automatically constitute an outlier unless it deviates significantly from what the regression predicts.
Large Residuals as Indicators of Outliers
Residuals are central to identifying atypical points. A large residual indicates that the model’s prediction does not align with the actual observation.
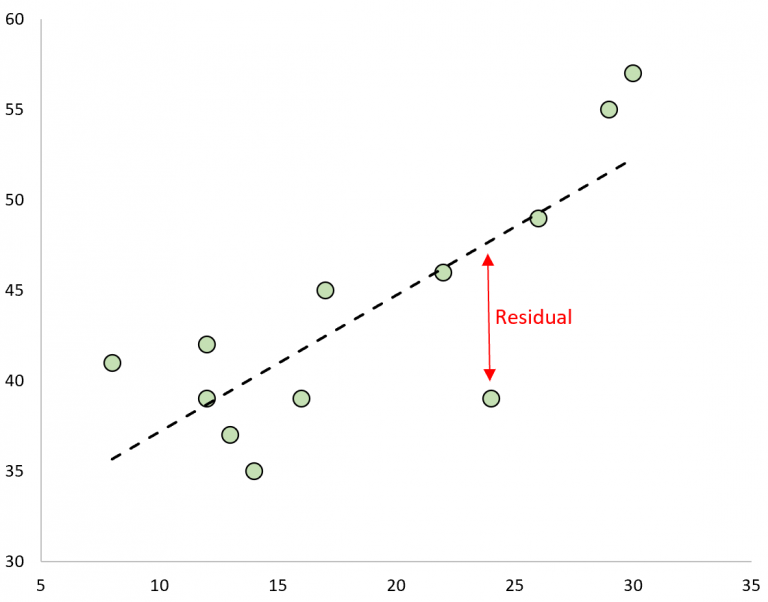
Scatterplot illustrating a residual as the vertical distance between an observed point and the regression line, emphasizing that unusually large residuals may signal outliers. Source.
Residual: The difference between the observed response value and the predicted value from the LSRL, computed as .
Because regression aims to minimize the sum of squared residuals, any point with an unusually large residual stands out in both the numerical data and graphical displays.
Residual plots are especially helpful for spotting these discrepancies.
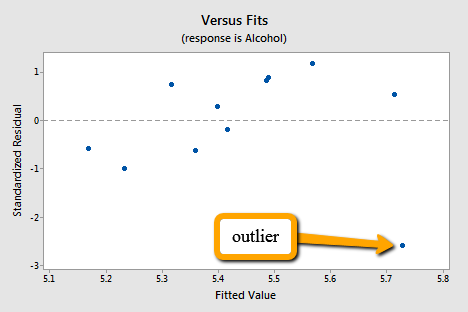
Residual plot highlighting a point whose residual lies far from the typical pattern, demonstrating how outliers become visually apparent when residuals are graphed against fitted values. Source.
Points that appear vertically distant from the horizontal axis in a residual plot suggest deviation from the expected linear relationship, and such points merit closer examination.
Methods for Identifying Outliers
Students should employ multiple strategies to identify outliers effectively. No single approach is definitive, but several methods used together provide a clear indication of unusual behavior within the data.
Key strategies include:
Inspecting raw scatterplots to determine whether a data point visibly deviates from the overall trend.
Examining residual plots to locate observations that fall far from the general pattern of residuals around zero.
Comparing residual magnitudes, ensuring that potential outliers have deviations meaningfully larger than typical residual variation.
Using technology-generated diagnostic values, such as standardized or studentized residuals, when available, to highlight points that exceed common thresholds.
Reassessing data entry or measurement errors, confirming that any detected outlier represents genuine data and not an artifact.
After applying these strategies, it is crucial to interpret a point’s status not merely by numerical difference but by context—some points may appear unusual yet remain legitimate components of the dataset.
Impact of Outliers on Regression Models
Outliers can significantly alter a regression model in ways that may misrepresent the actual relationship between the variables. Their effects include:
Distorting the slope, causing the line to tilt more or less steeply than warranted by the majority of the data.
Shifting the y-intercept, potentially leading to misleading predictions when extrapolating or evaluating initial values.
Inflating or deflating the correlation coefficient, which may give the false impression of a stronger or weaker linear association.
Altering predictions, resulting in inaccurate estimates of the response variable, especially near the outlier’s x-value.
These effects underscore why identifying and understanding outliers is a crucial step in model evaluation. In some cases, removing an outlier may be justified to improve model accuracy; in others, retaining it provides meaningful insight into variability or special conditions within the dataset.
Visual Tools for Identifying Outliers
Graphical displays remain a powerful means of detecting outliers. Both scatterplots and residual plots help highlight whether a data point does not conform to the expected linear pattern.
Students should observe:
Whether a point is vertically distant from the LSRL.
Whether a point appears isolated from clusters of typical observations.
Whether a point produces a residual far from zero even when surrounding points show small deviations.
Visual identification should always be paired with contextual reasoning to avoid misclassification of natural variation as an outlier.
FAQ
When variability is naturally large, a point should be compared not only to the overall pattern but also to the typical spread of residuals. A value may be extreme in the scatterplot yet still consistent with the expected error range.
A helpful approach is to compare the point’s residual with the distribution of all residuals:
• If most residuals cluster tightly around zero, a much larger residual is more likely to be an outlier.
• If residuals are widely dispersed, a point needs to be exceptionally extreme to be considered unusual.
Such points are not classified as outliers in the regression sense, because outliers are defined by unusually large residuals.
However, points with extreme x-values may still require attention because they could be high-leverage points. These points have more influence on the fitted regression line even if they align closely with the model.
Thus, while not regression outliers, they still warrant scrutiny during model evaluation.
Begin by verifying the original data source to confirm whether the recorded value matches the raw measurement.
If an error is confirmed:
• Correct the point if the true value is available.
• Remove the point only if it cannot be repaired and is clearly not a legitimate observation.
If uncertainty remains, keep the value but comment on its potential impact. Transparency about suspected errors is preferred over unacknowledged data removal.
Correlation is sensitive to both distance from the line and the location of points in the horizontal direction. A single extreme point with a large residual can disproportionately alter the calculation because correlation is based on deviations from the means of both variables.
A distant point can artificially inflate or deflate correlation depending on whether it aligns with or opposes the overall direction of association. This makes correlation unreliable when unchecked outliers are present.
Yes. Outliers may represent meaningful real-world phenomena rather than mistakes.
You may choose to keep an outlier when:
• It reflects a genuine but rare condition within the population.
• It provides insight into unusual behaviour that is relevant to the research question.
• The goal is to understand all observed patterns, including atypical responses.
In such cases, analysts often report results both with and without the outlier to show its influence transparently.
Practice Questions
Question 1 (1–3 marks)
A scatterplot shows a clear linear trend between two quantitative variables. One point lies far above the regression line and has a much larger residual than all other points.
(a) State what this point is called in the context of regression.
(b) Explain why this point is considered unusual.
Question 1
(a) 1 mark
• Correct identification: “outlier” or “regression outlier”.
(b) 1–2 marks
• 1 mark for stating that it has a much larger residual than the other points.
• 1 further mark for explaining that it deviates from the general linear pattern / does not fit the trend / lies far from the regression line.
Question 2 (4–6 marks)
A researcher fits a least squares regression line to a set of bivariate data relating hours of revision (x) to test scores (y). A residual plot is produced. Most residuals are close to zero, except for one point that has a very large negative residual.
(a) Describe what a negative residual indicates about the observed value compared with the predicted value.
(b) Explain why this point may be classified as an outlier in regression.
(c) Give two potential consequences this outlier could have on the regression model if it is included in the analysis.
Question 2
(a) 1–2 marks
• 1 mark for stating that the observed value is lower than the predicted value.
• 1 additional mark for explaining that the model overestimates the score for this point.
(b) 1–2 marks
• 1 mark for noting that its residual is substantially larger in magnitude than typical residuals.
• 1 mark for noting that it does not follow the overall linear pattern / is far from the rest of the points.
(c) 2–3 marks
Award up to 3 marks for any two valid consequences, including:
• It may distort the slope of the regression line.
• It may shift the y-intercept.
• It may artificially weaken or strengthen the correlation value.
• It may reduce the accuracy of predictions near that x-value.
