
AP Syllabus focus:
‘VAR-4.B & VAR-4.B.1: Interpret probabilities for events, focusing on understanding probabilities as long-run relative frequencies. This perspective allows probabilities to be seen not just as abstract numbers but as indicators of how frequently an event is expected to occur over repeated trials.’
Interpreting probabilities involves understanding them as measures of long-run behavior, helping students connect numerical likelihoods to repeated outcomes in real contexts and strengthening conceptual reasoning about chance events.
Interpreting Probabilities as Long-Run Relative Frequencies
Interpreting probabilities requires recognizing that a probability is more than a theoretical value—it is a long-run relative frequency, meaning the proportion of times an event occurs over many repeated trials of the same random process.
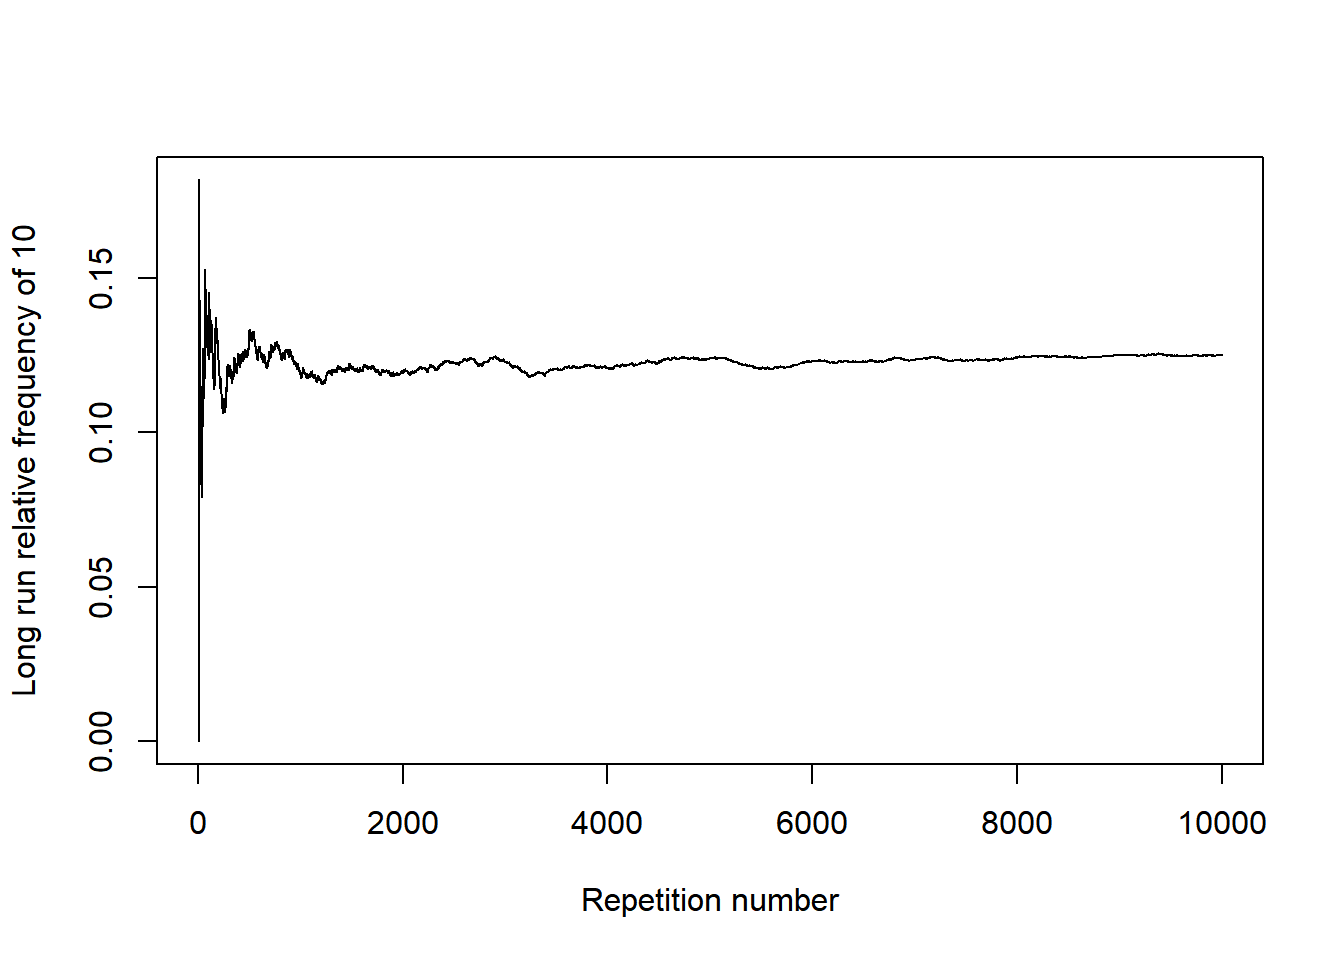
Line graph showing the running relative frequency of obtaining a sum of 10 when rolling three fair six-sided dice many times. The curve fluctuates initially before stabilizing near a long-run value, illustrating how empirical frequencies approach true probabilities as trials increase. The dice context exceeds syllabus scope, but the essential concept is the convergence of relative frequency. Source.
This interpretation links numerical probability values directly to observable patterns in repeated experimentation or simulations. AP Statistics emphasizes that probabilities should be understood as descriptors of long-term behavior, not predictions of individual outcomes.
When discussing an event, the term refers to a collection of possible outcomes that share a specified characteristic. Understanding probabilities in this context supports accurate reasoning about the likelihood of events in both empirical and theoretical scenarios.
The Long-Run Relative Frequency Interpretation
The heart of this subsubtopic is the idea that probabilities describe what happens in the long run, not what must occur in a single instance. A probability such as 0.25 indicates that, across a very large number of identical and independent repetitions of the random process, the event is expected to occur in roughly 25% of the trials.
Key Ideas Underlying the Long-Run Perspective
Repetition of a random process is fundamental for interpreting probabilities. Reliable probability estimates require imagining or conducting many trials.
Stability emerges over time: although the proportion of successful outcomes may fluctuate in early trials, it tends to stabilize as the number of trials becomes large.
Interpretation depends on context: probabilities should be expressed using appropriate units and framed in terms of long-run expectations (e.g., “about three out of every ten trials”).
Individual outcomes remain unpredictable, even when long-run behavior is stable. This distinction helps students avoid misinterpretations like the gambler’s fallacy.
Probability as a Measure of Likelihood
Probability values always fall between 0 and 1, and interpreting these values involves connecting them to frequency-based reasoning. When students interpret probabilities operationally, they consider how often an event is expected to occur relative to the total number of opportunities for its occurrence.
Understanding What Probability Values Represent
A probability close to 0 indicates that an event is highly unlikely over the long run.
A probability close to 1 indicates that an event is very likely to occur in repeated trials.
A probability around 0.5 indicates that, in the long run, the event should happen about half the time.
Interpreting probability values in these terms enhances students’ ability to meaningfully communicate how likely events are in everyday and statistical contexts.
Clarifying the Meaning of Relative Frequency
The term relative frequency refers to the ratio of the number of times an event occurs to the total number of trials. It provides a concrete way to visualize or compute probability through repeated experimentation or simulation.
Relative Frequency: The proportion of trials in which a specific event occurs, calculated as the number of successful outcomes divided by the total number of trials.
Thinking in terms of relative frequency reinforces the foundational concept that probabilities are not one-time expectations but long-term tendencies.
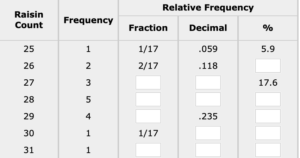
Relative frequency table showing raisin count frequencies represented as fractions, decimals, and percentages. The table demonstrates how relative frequencies express proportions of a whole and sum to 1, reinforcing probability as long-run proportion. Some contextual details, such as raisin counts, extend beyond the syllabus but support the core concept of proportional representation. Source.
A relative frequency approach is especially useful when theoretical probabilities are difficult to determine or when empirical data are used to estimate likelihoods.
Linking Interpretation to Random Processes
A random process is any procedure that produces outcomes determined by chance. Understanding probabilities as long-run relative frequencies requires imagining or observing the process repeated many times under identical conditions. This consistent framework ensures that the interpretation of probability remains tied to the behavior of the process rather than subjective judgment.
Random Process: A repeatable procedure that generates outcomes governed by chance, producing variability across trials but stable long-run patterns.
Considering random processes in this way supports the accurate interpretation of probabilities as long-run proportions, as emphasized in the specification.
Communicating Probability Interpretations
Interpreting and communicating probabilities effectively requires translating numerical values into language that reflects long-run expectations. Students should avoid stating that an event “will” or “must” occur based on its probability; instead, they should frame interpretations in terms of expected frequency over many repetitions.
Effective Phrasing for Probability Interpretation
“In the long run, this event would occur about ___% of the time.”
“Across many repeated trials of the process, we expect this outcome to happen roughly ___ out of ___ times.”
“The probability suggests a stable long-term tendency, not a guarantee in a single trial.”
Distinguishing Probability from Short-Run Patterns
A critical part of interpreting probabilities is understanding that short-run outcomes may deviate substantially from expected long-run behavior.
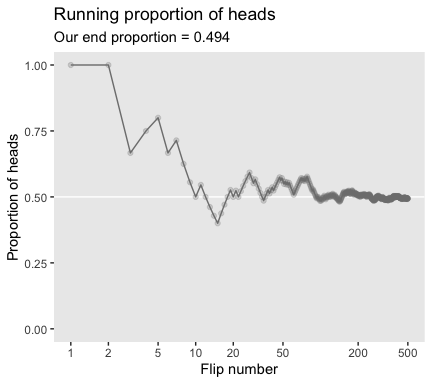
Line graph showing the running proportion of heads across many simulated coin flips. The proportion varies widely at first but converges toward 0.5 as trial count increases, illustrating short-run variability versus long-run stability. The logarithmic x-axis extends beyond the syllabus but effectively emphasizes convergence over many scales of repetition. Source.
Variability in small samples is not contradictory to the established probability; rather, it reflects the natural unpredictability of individual random events.
Important Distinctions
Short-run variability is expected and does not indicate incorrect probabilities.
Long-run stability emerges only with many repetitions.
Interpretation must always reference repeated trials, even when presented with limited empirical data.
These ideas reinforce the specification’s emphasis on connecting probabilities to their long-run relative frequency meaning and using this connection to interpret the likelihood of events consistently and accurately.
FAQ
Empirical probability from a short experiment reflects only the outcomes observed in that limited set of trials and is highly influenced by random fluctuation.
Long-run relative frequency refers to the behaviour of the proportion as the number of trials becomes very large. It represents the stable value the proportion approaches, not the value from any single small dataset.
Stabilisation depends on how variable the event outcomes are. Rare events, or events with high variability in counts, may need far more observations to exhibit consistent long-run behaviour.
More trials reduce noise, but for events with probabilities near 0 or 1, the proportion can fluctuate dramatically early on, delaying stabilisation.
Yes. Distinct processes can yield the same long-run proportion for a particular outcome even if their mechanisms differ.
For example:
• A fair spinner landing on one of four equal sectors has a probability of 0.25 for any given sector.
• A rolling process involving dice could also produce an event with probability 0.25.
The processes differ, but the long-run relative frequency is the same.
It shifts focus away from predicting individual outcomes, which are inherently unpredictable, and towards repeated behaviour over many trials.
This decreases the likelihood of errors such as believing outcomes must “even out” quickly or assuming that a short streak implies bias.
Independence ensures that each trial contributes equally to the long-run pattern. Without independence, earlier outcomes could influence later ones, distorting proportional stability.
If trials are not independent, long-run behaviour may not reflect a single fixed probability, and relative frequencies might not stabilise at all.
Practice Questions
Question 1 (1–3 marks)
A factory states that the probability a randomly selected light bulb is defective is 0.04. Explain what this probability means in terms of long-run relative frequency.
Question 1 (1–3 marks)
• 1 mark: States that 0.04 represents the proportion of defective bulbs over many bulbs or in the long run.
• 1 mark: Makes clear that the value does not guarantee that every group of bulbs will have exactly 4% defective.
• 1 mark: Refers to repeated sampling or large numbers of bulbs showing stable long-run behaviour
Question 2 (4–6 marks)
A fair coin is flipped repeatedly as part of an investigation into long-run behaviour.
After 20 flips, the proportion of heads is 0.65. A student claims this proves the coin is biased.
a) Explain why the result of the first 20 flips does not necessarily indicate that the coin is biased.
b) Describe how the long-run relative frequency interpretation of probability relates to the expected proportion of heads.
c) Explain how increasing the number of flips would help assess whether the coin is biased.
Question 2 (4–6 marks)
a)
• 1 mark: Notes that 20 flips is a small number and subject to high short-run variability.
• 1 mark: Explains that unusual short-run results can occur even when the coin is fair.
b)
• 1 mark: States that for a fair coin, the long-run proportion of heads should approach 0.5.
• 1 mark: Indicates that probability is interpreted as long-run relative frequency.
c)
• 1 mark: Explains that increasing the number of flips reduces the effect of short-run fluctuations.
• 1 mark: States that observing convergence (or lack thereof) of the proportion of heads to 0.5 helps assess whether the coin is biased.
