
AP Syllabus focus:
‘The one-sample t-interval for a mean is the correct procedure when the population standard deviation is unknown and the sample standard deviation s is used. For matched pairs, the differences are treated as a single sample of differences. Inferences for confidence intervals proceed similarly to those for a single population mean.’
This subsubtopic explains how to choose the appropriate procedure for constructing confidence intervals for population means when the population standard deviation is unknown.
Understanding When to Use a t-Interval
When estimating a population mean, the one-sample t-interval is used whenever the population standard deviation is unknown and the sample standard deviation provides the best available estimate. This choice reflects the reality that most real-world data sets do not come with a known population standard deviation, requiring an approach that incorporates additional uncertainty. Because the t-distribution accounts for this uncertainty, it becomes the foundation for valid inference about a population mean.
Because σ is unknown, the standardized statistic follows a Student’s t-distribution rather than a standard normal distribution.
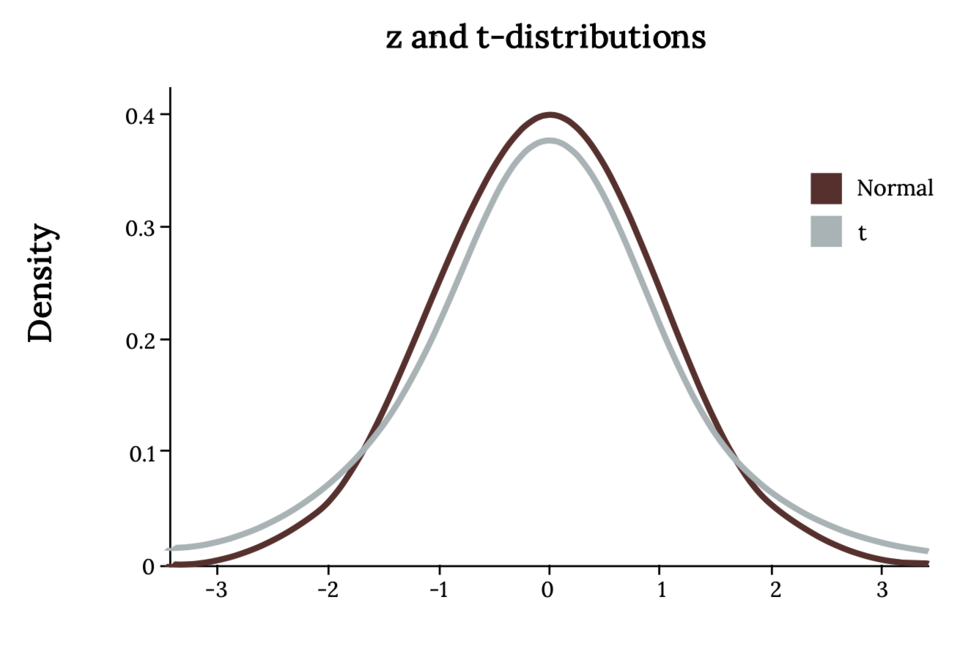
This figure compares the normal distribution with several t-distributions, showing heavier tails for smaller degrees of freedom and convergence toward normality as degrees of freedom increase. Source.
Key Features of the One-Sample t-Interval
A one-sample t-interval relies on information from a single random sample and is appropriate under conditions ensuring independence and approximate normality of the sampling distribution. The reasoning behind this interval centers on estimating the population mean while acknowledging potential error introduced by relying on sample statistics.
Before introducing formal notation, it is useful to recognize that t-based inference is designed to adjust for the extra variability that arises when replacing the population standard deviation with the sample standard deviation.
EQUATION
= sample mean
= critical value from the t-distribution based on degrees of freedom
= sample standard deviation
= sample size
The formula highlights how both sample variability and desired confidence level influence the interval's width.
Selecting the Procedure When σ Is Unknown
Because the population standard deviation σ is almost never known, the appropriate procedure is the one-sample t-interval rather than a z-interval. This distinction is essential for AP Statistics students, as using the wrong procedure results in incorrect conclusions. The t-distribution’s heavier tails offer a more conservative and realistic model when estimating variability from sample data.
Why Sample Standard Deviation Matters
The sample standard deviation introduces uncertainty because it is only an estimate. The t-distribution compensates for this by widening the interval relative to a normal-based interval. As sample size increases, the t-distribution approaches the normal distribution, meaning the procedure becomes more precise with larger samples.
Matched Pairs and the One-Sample t-Interval
Some studies involve matched pairs, a design in which each observational unit provides two related measurements. These pairs often represent “before–after” scenarios or matched individuals with similar characteristics. In such cases, inference must consider the difference between paired observations rather than the raw values themselves.
Matched Pairs: A study design in which two related observations are collected for each unit, requiring analysis of differences within each pair.
Once differences are calculated, they form a single list of quantitative values that behave like a one-sample dataset. This transformation allows the matched pairs situation to be handled using the same t-interval procedure applied to a single quantitative variable.
The key is that the analysis depends on the mean and standard deviation of these differences, not of the original measurements. Treating differences as a single sample ensures that the interval accurately reflects the direction and magnitude of change across pairs.
For a matched pairs setting, compute the difference for each pair and treat these differences as a single sample of quantitative data when constructing the t-interval.
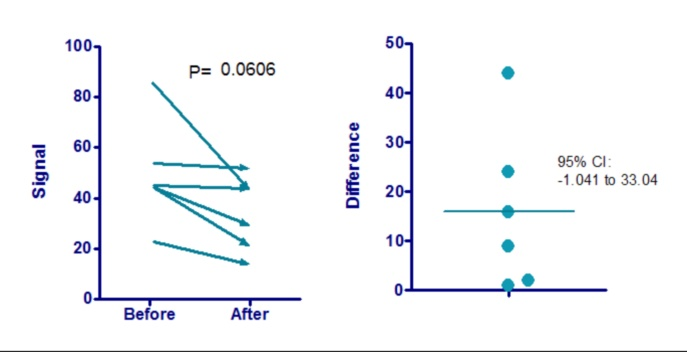
The left panel shows paired observations linked for each subject, while the right panel displays the distribution of differences and their confidence interval, illustrating how paired data become a single sample of differences for t-interval construction. Source.
Procedure for Applying the Correct Interval
Students should be able to identify when to use the one-sample t-interval and how the structure of a study directs this choice. The following points summarize the procedural reasoning:
One-Sample t-Interval for a Mean
Use this when:
σ is unknown, and the sample standard deviation must be used instead.
The data come from a single random sample of quantitative values.
Conditions such as independence and approximate normality are satisfied.
Matched Pairs t-Interval
Use this when:
The study collects paired observations on a single group of individuals or units.
The analysis focuses on the differences between paired values.
These differences can be treated as a single set of quantitative data.
Important Considerations
The form of the interval does not change between one-sample and matched pairs procedures; only the data used in the calculation differ.
Sample size and the shape of the distribution influence how reliably the procedure performs.
Independence in data collection is essential for valid inference.
Distinguishing This Procedure from Others
Students must differentiate the one-sample t-interval from:
z-intervals, which require known σ and thus apply in only limited scenarios.
Two-sample intervals, which are used when comparing means from two independent groups rather than estimating a single mean or paired difference.
Non-inference procedures, which might summarize sample data but do not quantify uncertainty about the population.
The focus of this subsubtopic is knowing which confidence interval procedure is appropriate and why the one-sample t-interval—along with its matched pairs adaptation—is the correct and justified choice in most situations involving unknown population variability.
FAQ
A large sample size does not eliminate the fact that the population standard deviation is unknown. The z-interval specifically requires that value to be known, not estimated.
Even when the sample size is large, the t-interval is still theoretically correct because it incorporates uncertainty from using the sample standard deviation. Although the t-distribution becomes very close to the normal distribution for large samples, using a z-interval remains technically inappropriate unless the population standard deviation is genuinely known.
The choice of procedure does not change with sample size: the t-interval is still required whenever the population standard deviation is unknown.
However, sample size affects how closely the t-distribution approximates the normal distribution. Larger samples reduce the impact of heavier tails and produce narrower confidence intervals, but the underlying reasoning for using a t-interval remains the same.
Matched pairs treat each pair of observations as linked, reducing the influence of between-subject variability. This increases the sensitivity of the interval to detect meaningful changes.
In contrast, independent samples treat each observation as unrelated, requiring the use of a two-sample procedure. The matched structure shapes both the calculation and interpretation of the interval, as it focuses on within-pair differences rather than overall group averages.
Conditions such as normality and independence must apply to the set of differences, not to the original before and after measurements.
Since the inference procedure is based on these differences, any assessment of skewness, outliers, or random sampling must reflect the behaviour of the transformed dataset. Verifying conditions on the raw measurements could be misleading and does not ensure the assumptions of the matched pairs t-interval are satisfied.
Matched pairs are appropriate when each unit provides two related measurements, or when units are intentionally paired to control for variability.
Examples include:
• Before–after studies on the same subjects
• Measurements from twins or siblings
• Experiments where two treatments are applied to closely matched units
These designs reduce extraneous variation and allow the t-interval to focus on the true mean change or difference attributable to the factor being studied.
Practice Questions
Question 1 (1–3 marks)
A researcher collects a random sample of 20 measurements from a population where the population standard deviation is unknown. They plan to construct a confidence interval for the population mean.
(a) Which inference procedure should the researcher use?
(b) Give one reason why this is the appropriate procedure.
Question 1
(a) 1 mark
• Correct procedure identified as the one-sample t-interval for a mean.
(b) 1–2 marks
• Award 1 mark for stating that the population standard deviation is unknown.
• Award 1 mark for noting that using the sample standard deviation requires the t-distribution, not the normal distribution.
(Maximum 3 marks)
Question 2 (4–6 marks)
A nutritionist records the calorie content of meals before and after a recipe modification using 15 matched meal pairs. She wishes to construct a confidence interval to estimate the mean change in calorie content.
(a) Explain how the data should be prepared before constructing the interval.
(b) State the correct inference procedure for this study and justify why it is appropriate.
(c) Give one condition that must be checked before using this procedure.
Question 2
(a) 1–2 marks
• 1 mark for stating that the differences between the before and after calorie values should be calculated.
• 1 mark for identifying that these differences should be treated as a single sample.
(b) 1–2 marks
• 1 mark for identifying the matched pairs t-interval (or one-sample t-interval on the differences).
• 1 mark for justifying this choice by referring to paired data or repeated measures on the same units.
(c) 1–2 marks
• 1 mark for naming a valid condition, such as independence of the pairs or approximate normality of the distribution of differences.
• 1 additional mark for a correct description of the condition, such as requiring random sampling or checking for strong skewness or outliers when sample sizes are small.
(Maximum 6 marks)
