
AQA Specification focus:
‘What is meant by AD.’
Aggregate demand (AD) is central to macroeconomic analysis, showing total planned spending within an economy at a given price level. Understanding AD underpins analysis of growth, inflation, and employment.
Understanding Aggregate Demand
Aggregate demand (AD) refers to the total amount of goods and services demanded in an economy at a given overall price level and in a specific time period. It captures the planned expenditure of households, firms, the government, and foreign buyers on a nation’s output.
Aggregate Demand (AD): The total planned expenditure on goods and services produced within an economy at a given general price level over a period of time.
This concept is a foundation for analysing how economies function, as changes in AD can significantly affect national output, income, and employment levels.
Components of Aggregate Demand
Aggregate demand is expressed through four main components, often summarised as C + I + G + (X – M):
Consumption (C): Spending by households on goods and services.
Investment (I): Expenditure by firms on capital goods like machinery, buildings, and technology.
Government Spending (G): Public expenditure on services, infrastructure, and welfare.
Net Exports (X – M): Exports minus imports, reflecting international trade’s impact on domestic demand.
Aggregate Demand (AD) = C + I + G + (X – M)
C = Household consumption expenditure
I = Business investment in capital goods
G = Government spending on public services and infrastructure
X = Value of exports
M = Value of imports
Between these categories, household consumption usually makes up the largest share, making it a critical driver of economic activity.
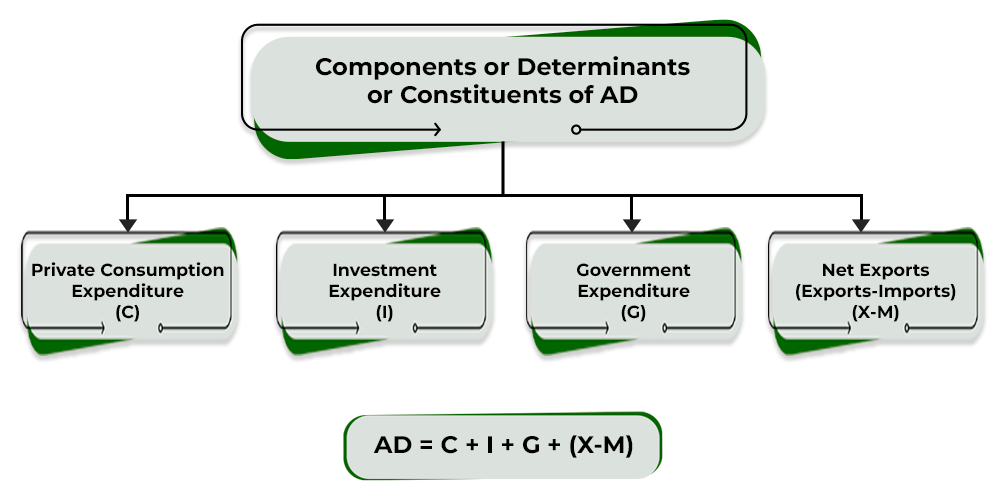
This diagram outlines the four components of aggregate demand: Consumption (C), Investment (I), Government Spending (G), and Net Exports (X – M). Understanding these components is crucial for analysing shifts in the AD curve. Source
AD as a Curve
In macroeconomics, AD is represented as a downward-sloping curve on a graph where the vertical axis is the general price level and the horizontal axis is real output (national income).
The downward slope of the AD curve reflects three main effects:
Wealth effect: As the price level falls, the real value of money and assets increases, encouraging higher spending.
Interest rate effect: Lower prices reduce demand for money, pushing interest rates down and stimulating borrowing and investment.
International competitiveness effect: A fall in domestic prices makes exports more competitive and imports less attractive, boosting net exports.
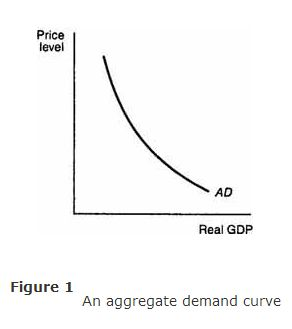
This diagram depicts the aggregate demand (AD) curve, showing the inverse relationship between the price level and the quantity of output demanded. The downward slope is attributed to the wealth effect, interest rate effect, and international competitiveness effect, as detailed in the study notes. Source
This downward slope highlights the inverse relationship between the price level and real output demanded.
Distinction from Microeconomic Demand
It is important to distinguish aggregate demand from individual market demand:
Micro demand concerns the quantity of a particular good or service demanded at various prices.
Aggregate demand encompasses all goods and services within the economy, considering the total expenditure at each general price level.
This broader focus allows economists to assess the health and performance of entire economies rather than single markets.
Determinants of AD
Although the specification places emphasis on what AD means, recognising the factors that influence it helps in grasping its significance. Each component can be affected by multiple factors:
Consumption (C): Household income, interest rates, consumer confidence, and taxation.
Investment (I): Business expectations, availability of credit, technological innovation, and corporate taxation.
Government Spending (G): Fiscal policies, political priorities, and macroeconomic objectives.
Net Exports (X – M): Exchange rates, global economic conditions, and trade policies.
Even though these determinants are covered more deeply in other subsubtopics, acknowledging them here clarifies why AD is dynamic and rarely fixed.
Real vs Nominal Representation
AD is measured in terms of real GDP, rather than nominal GDP, to account for inflation. This ensures the focus is on actual output and demand rather than price-level distortions.
For example, an increase in nominal GDP might reflect higher prices, not greater real demand. By contrast, real GDP isolates true increases in goods and services purchased.
Why AD Matters in Macroeconomics
Aggregate demand provides critical insight into the performance of the whole economy:
It helps policymakers analyse whether an economy is underperforming or overheating.
It underpins fiscal and monetary policy decisions aimed at stabilising growth, employment, and inflation.
It provides a framework to explain phenomena such as recessions (falling AD) or booms (rising AD).
Because AD is connected to national income and employment, it acts as a crucial indicator of economic stability and long-term development.
Practice Questions
Define aggregate demand (AD). (2 marks)
1 mark for identifying AD as total expenditure/demand in the economy.
1 mark for specifying that it is measured at a given general price level over a period of time.
Explain why the aggregate demand (AD) curve slopes downwards. (6 marks)
Up to 2 marks for explaining the wealth effect: lower price levels increase the real value of money/assets, leading to more consumption.
Up to 2 marks for explaining the interest rate effect: lower prices reduce demand for money, lowering interest rates and encouraging investment and borrowing.
Up to 2 marks for explaining the international competitiveness effect: lower domestic prices make exports more competitive and imports less attractive, increasing net exports.
(Maximum 6 marks – allow up to 2 marks per effect, but award only where there is clear explanation, not just identification.)
FAQ
Aggregate demand measures planned expenditure at a given price level, not the actual spending that occurs. Actual spending can differ due to unplanned changes in inventories, unexpected shocks, or variations in consumer and business behaviour.
Planned AD is therefore a theoretical concept used to model economic activity, while actual spending reflects real-world outcomes in any given period.
Economists use varying price levels to show how planned expenditure changes in response to inflation or deflation.
This allows for the creation of the downward-sloping AD curve, highlighting the relationship between total demand and the price level, which would not be clear if only one price level were used.
No, aggregate demand is the planned demand for output, while GDP is the actual value of goods and services produced.
If AD exceeds GDP, inventories may fall and output may rise to meet demand.
If GDP exceeds AD, firms may face rising inventories and could reduce production.
Household spending tends to dominate because:
Most income earned in an economy is used for consumption.
Consumption is continuous and less volatile than investment or net exports.
Even in recessions, households still spend on essentials, ensuring consumption remains a major share of AD.
A persistent fall in AD indicates weakening demand for goods and services, signalling risks of reduced output and rising unemployment.
Policymakers monitor AD trends to decide whether to implement fiscal or monetary measures, such as cutting interest rates or increasing government spending, to stimulate demand and stabilise the economy.
