AQA Specification focus:
‘Students should be able to use a simple numerical example to illustrate the principle of comparative advantage and the associated benefits of trade.’
Understanding comparative advantage is central to A-Level Economics. This concept shows why countries specialise and trade, leading to higher total output, efficiency gains, and improved global resource allocation.
Understanding Comparative Advantage
Comparative advantage is a core idea in international trade theory. It explains why countries benefit from specialising in goods or services where they have a lower opportunity cost compared to others. This differs from absolute advantage, which only considers productivity levels.
Comparative Advantage: The ability of a country to produce a good or service at a lower opportunity cost than another country.
Opportunity Cost and Specialisation
Opportunity cost is essential to understanding comparative advantage. It refers to the next best alternative foregone when making a choice.
Opportunity Cost: The cost of the next best alternative foregone when a choice is made.
Countries specialise in producing goods where their opportunity cost is lowest. This means that even if one country is less efficient at producing everything, trade can still be mutually beneficial.
The Role of Numerical Examples
A numerical example demonstrates comparative advantage clearly. By using simplified figures, we can illustrate how trade leads to increased total output and economic welfare.

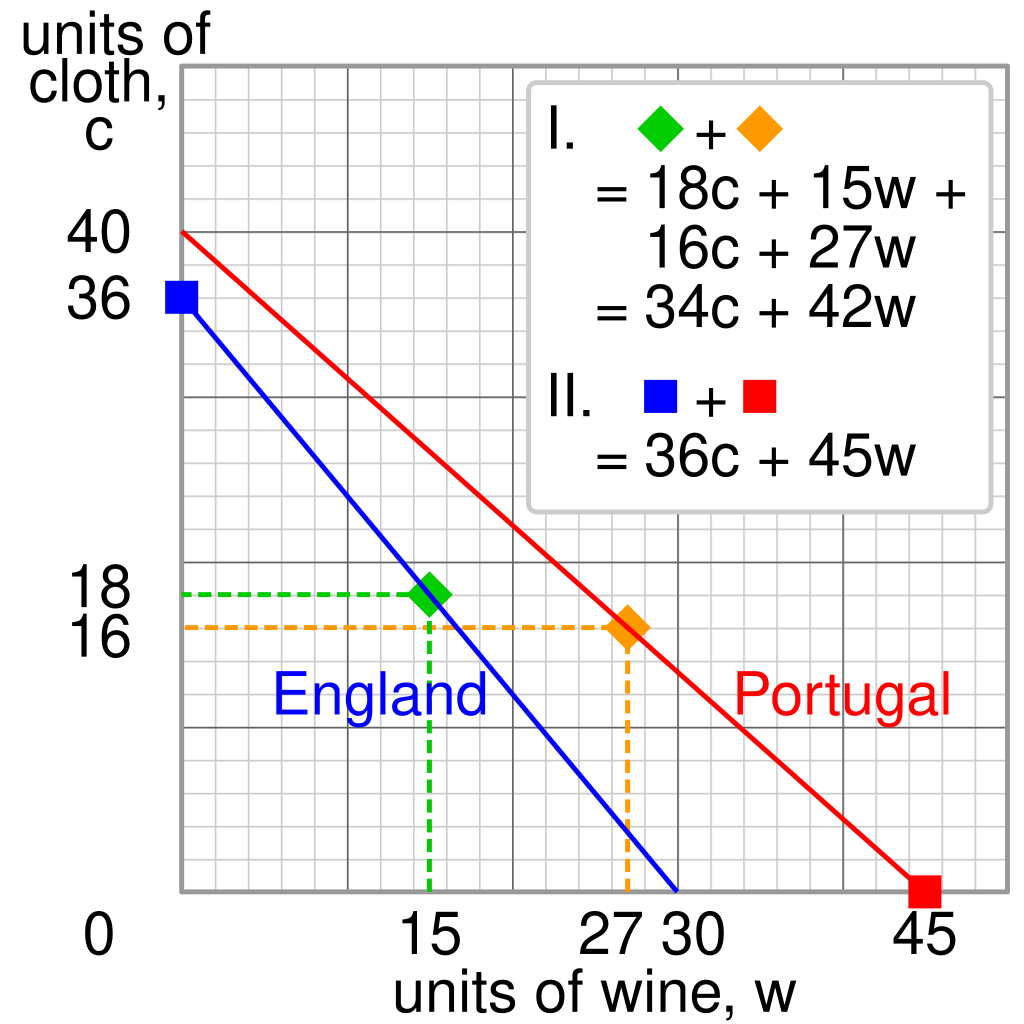
This diagram depicts Ricardo's example of comparative advantage, illustrating how specialisation according to comparative advantage leads to greater total output in the same duration. Source
Country A may produce fewer units of all goods than Country B.
However, if Country A sacrifices fewer units of one good to produce another, it holds a comparative advantage in that product.
Trade allows each country to specialise according to their comparative advantage.
Specialisation ensures that total global production rises, making both countries better off.
Key Assumptions in the Model
The model of comparative advantage relies on several important assumptions. While these simplify reality, they help illustrate the concept clearly:
Two countries and two goods are considered.
Each country has different opportunity costs.
Factors of production are assumed to be immobile internationally but mobile domestically.
There are no transport costs or trade barriers.
Perfect competition ensures resources are used efficiently.
These assumptions allow the model to show the pure benefits of trade, though real-world conditions often differ.
Process of Identifying Comparative Advantage
When working through a numerical example, economists follow a structured process:
Identify production possibilities — how much of each good each country can produce.
Calculate opportunity costs — determine how much of one good must be sacrificed to produce another.
Compare opportunity costs — whichever country has the lower opportunity cost for a good has the comparative advantage in producing it.
Specialise and trade — countries specialise in their comparative advantage goods.
Assess gains — check how total output increases after trade compared to before.
This process demonstrates that comparative advantage drives global efficiency.

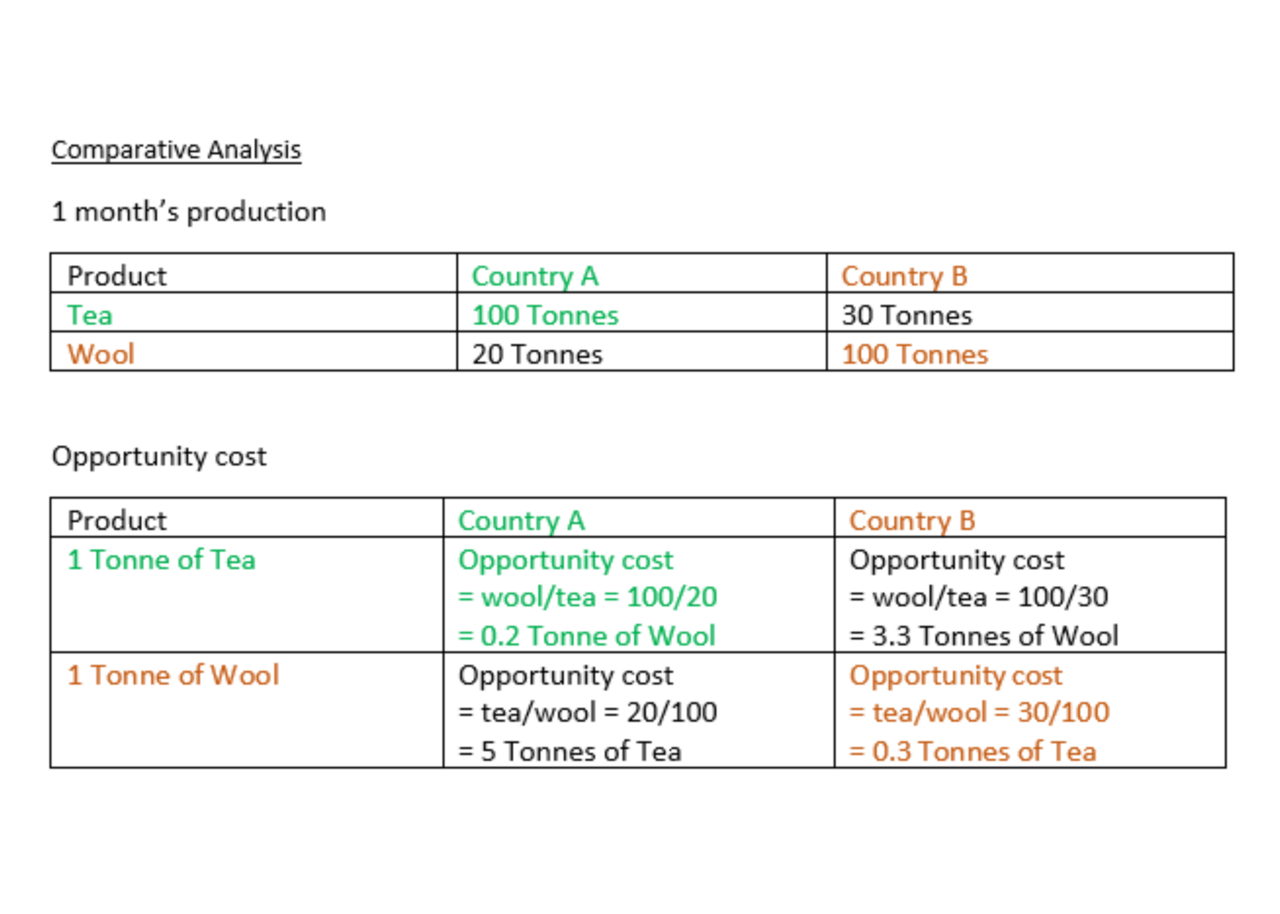
This image presents a simplified numerical example of comparative advantage, showing how calculating opportunity costs can determine the benefits of specialisation and trade. Source
Benefits of Trade from Comparative Advantage
Trade based on comparative advantage yields several significant benefits:
Higher total output: By specialising, world production exceeds what could be achieved without trade.
Efficient resource allocation: Scarce resources are directed to sectors where they are most productive.
Wider variety of goods: Countries can consume more than they produce domestically.
Lower prices: Increased efficiency and competition reduce average costs, benefiting consumers.
Economic growth: Trade fosters investment, innovation, and productivity improvements.
Limitations of the Model
While the numerical model is powerful, it has limitations:
Transport costs may offset the gains from trade.
Trade barriers such as tariffs and quotas reduce efficiency.
Imperfect competition can distort outcomes.
Changing opportunity costs: As countries specialise, costs may rise due to diminishing returns.
Non-tradable goods: Services like healthcare may not fit neatly into the model.
Distribution of gains: Not all groups benefit equally, creating winners and losers.
Recognising these limitations is crucial for applying the model to real-world trade situations.
Visualising the Gains
Though this section does not include diagrams, students should note that the model is often represented graphically. Production possibility frontiers (PPFs) are commonly used to illustrate how trade shifts consumption possibilities beyond domestic limits.
Production Possibility Frontier (PPF): A curve showing the maximum potential output combinations of two goods an economy can produce when resources are fully and efficiently employed.
This highlights how specialisation and trade expand the range of goods available.
Key Takeaways for Students
Comparative advantage depends on opportunity costs, not absolute productivity.
Even less efficient countries can benefit from trade if they specialise appropriately.
Numerical examples make the concept concrete by showing increased total output after trade.
The model demonstrates clear benefits, but assumptions must be considered carefully.
By mastering comparative advantage through numerical examples, students can better understand why global trade exists and how it contributes to economic welfare.
FAQ
Numerical examples simplify complex trade concepts into clear figures, making opportunity costs and specialisation easier to understand.
They help students visualise how total output changes before and after trade. By using numbers rather than abstract theory, economists can demonstrate the efficiency gains and the logic of specialisation more concretely.
Numerical examples assume perfect conditions:
Only two countries and two goods.
No transport costs or trade barriers.
Resources fully employed and perfectly mobile domestically.
In reality, trade involves many countries, countless goods, and factors like tariffs, exchange rates, and political considerations. The numerical model shows the principle in its simplest form.
Opportunity cost is the foundation of the model. It measures what must be sacrificed to produce more of one good.
In numerical examples, students calculate how much of Good A must be given up to produce one more unit of Good B. The country with the lower opportunity cost for a particular good is shown to have the comparative advantage in that good.
No, not under standard assumptions.
If one country has a lower opportunity cost in producing Good A, the other must have a lower opportunity cost in Good B. Comparative advantage is relative, so one country cannot dominate both in a two-good, two-country model.
Diagrams, particularly Production Possibility Frontiers (PPFs), visually show how specialisation and trade expand consumption beyond domestic production limits.
They reinforce the numerical example by illustrating efficiency gains graphically, making it easier to explain shifts in production and consumption points. Using both approaches demonstrates deeper understanding and meets exam requirements for application and analysis.
Practice Questions
Define comparative advantage. (2 marks)
1 mark for stating it involves producing at a lower opportunity cost compared to another country.
1 additional mark for specifying it refers to relative efficiency in producing goods/services.
Using a numerical example, explain how comparative advantage can lead to gains from trade between two countries. (6 marks)
1 mark for identifying that comparative advantage is based on opportunity cost.
1 mark for explaining that each country should specialise in the good where its opportunity cost is lower.
1–2 marks for describing or outlining a numerical example showing the calculation of opportunity costs.
1–2 marks for showing that specialisation increases total output.
1 mark for explaining how trade allows both countries to consume beyond their production possibility.

