
IB Syllabus focus:
‘IPCC uses emissions scenarios to project impacts (e.g., sea-level, temperature, precipitation); models inform planning despite uncertainty.’
Climate models and IPCC scenarios provide frameworks for understanding possible climate futures. They project temperature, precipitation, and sea-level changes, guiding international planning, mitigation, and adaptation strategies.
The Role of the IPCC in Climate Projections
The Intergovernmental Panel on Climate Change (IPCC) is the leading international body that assesses climate science. It synthesises peer-reviewed research to provide policymakers with credible projections of future climate conditions.
Emissions Scenarios
The IPCC employs emissions scenarios to outline potential future pathways of greenhouse gas (GHG) emissions, each linked to socio-economic, technological, and policy assumptions.
Emissions Scenario: A projected pathway of greenhouse gas emissions based on assumptions about population growth, economic activity, technology, and policy.
These scenarios are not predictions but structured narratives to explore a range of possible futures.
Representative Concentration Pathways (RCPs)
The Representative Concentration Pathways (RCPs) are four scenarios (RCP2.6, RCP4.5, RCP6.0, RCP8.5) defined by their radiative forcing in watts per square metre by 2100.
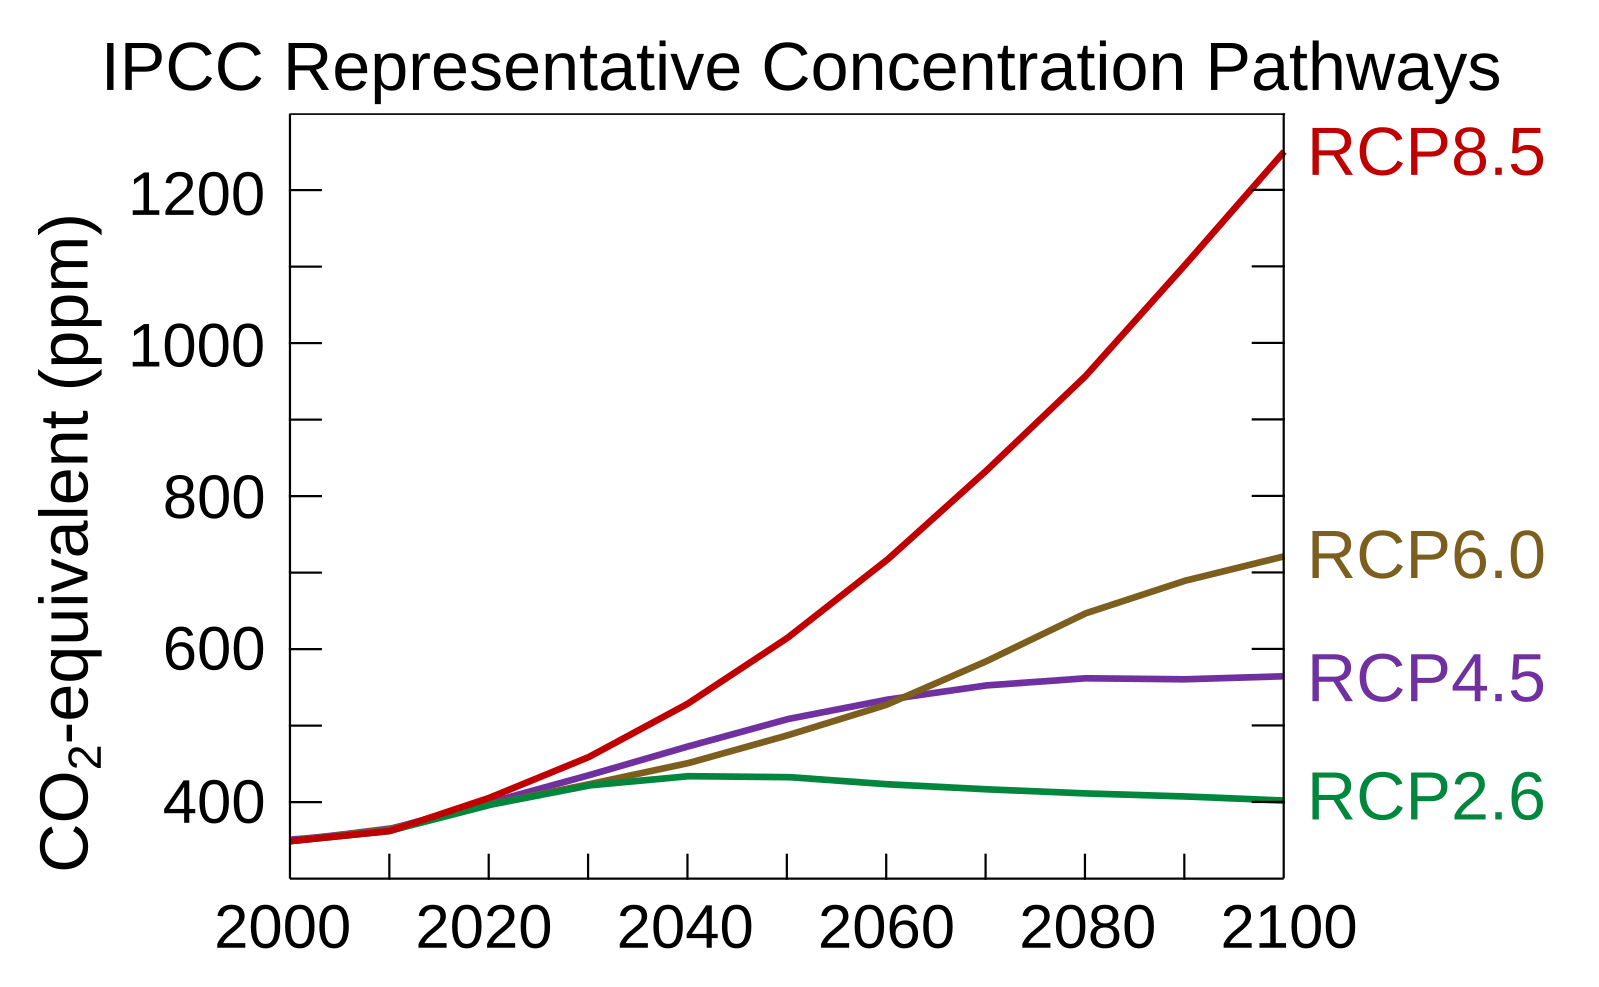
RCP pathways show projected atmospheric CO₂-equivalent concentrations for alternative futures, from stringent mitigation (RCP2.6) to high emissions (RCP8.5). The figure complements scenario discussion by illustrating how assumed pathways translate into different concentration trajectories used in climate models. Source.
RCP2.6: Strong mitigation, radiative forcing stabilises at ~2.6 W/m².
RCP4.5 and RCP6.0: Stabilisation scenarios with intermediate emissions.
RCP8.5: High-emissions “business as usual,” ~8.5 W/m² forcing.
Radiative Forcing: The change in the balance of incoming and outgoing energy in the Earth–atmosphere system due to greenhouse gases and aerosols, measured in W/m².
Shared Socioeconomic Pathways (SSPs)
In recent assessments, the IPCC combines Shared Socioeconomic Pathways (SSPs) with RCPs to provide more nuanced futures. SSPs describe narratives of societal development such as:
SSP1 – Sustainability (green growth and cooperation).
SSP2 – Middle of the road (continuation of current trends).
SSP3 – Regional rivalry (fragmentation and conflict).
SSP5 – Fossil-fuelled development (economic growth with high emissions).
These combinations allow researchers to evaluate both physical climate outcomes and socio-economic resilience.
Climate Modelling and Its Processes
Climate models simulate Earth’s climate system using mathematical representations of atmospheric, oceanic, land, and ice processes. They integrate physics, chemistry, and biology to project how the system responds to different GHG concentrations.
General Circulation Models (GCMs)
At the core of projections are General Circulation Models (GCMs), which divide the atmosphere and oceans into three-dimensional grids. Equations govern:
Energy transfer.
Movement of air and water.
Radiation interactions with gases and aerosols.
Energy Balance Equation: Incoming Solar Radiation – Reflected Solar Radiation – Outgoing Longwave Radiation = Net Energy Change
Incoming Solar Radiation = Energy received from the Sun (W/m²)
Reflected Solar Radiation = Energy reflected by clouds, aerosols, surface (W/m²)
Outgoing Longwave Radiation = Infrared radiation emitted back to space (W/m²)
This balance determines Earth’s average temperature response to increased GHGs.
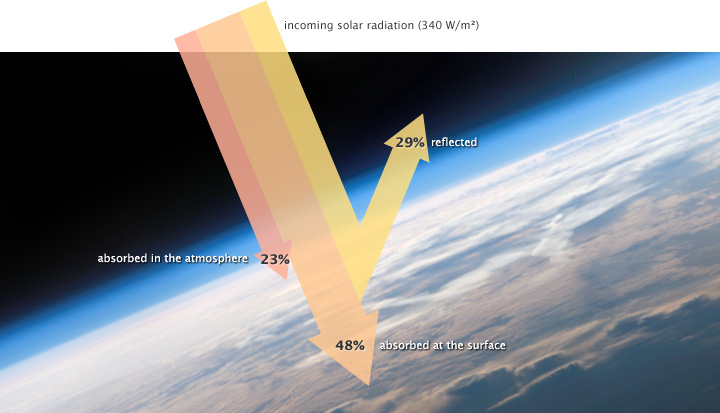
This diagram depicts the global energy budget: incoming solar radiation, reflection by clouds/atmosphere/surface, and outgoing thermal infrared from the Earth system. It supports the energy-balance discussion used in simple climate models and clarifies the role of radiative fluxes. Source.
Regional Climate Models (RCMs)
While GCMs are global, Regional Climate Models (RCMs) downscale data to focus on smaller areas. These provide projections for precipitation shifts, droughts, and extreme weather events at local and national levels.
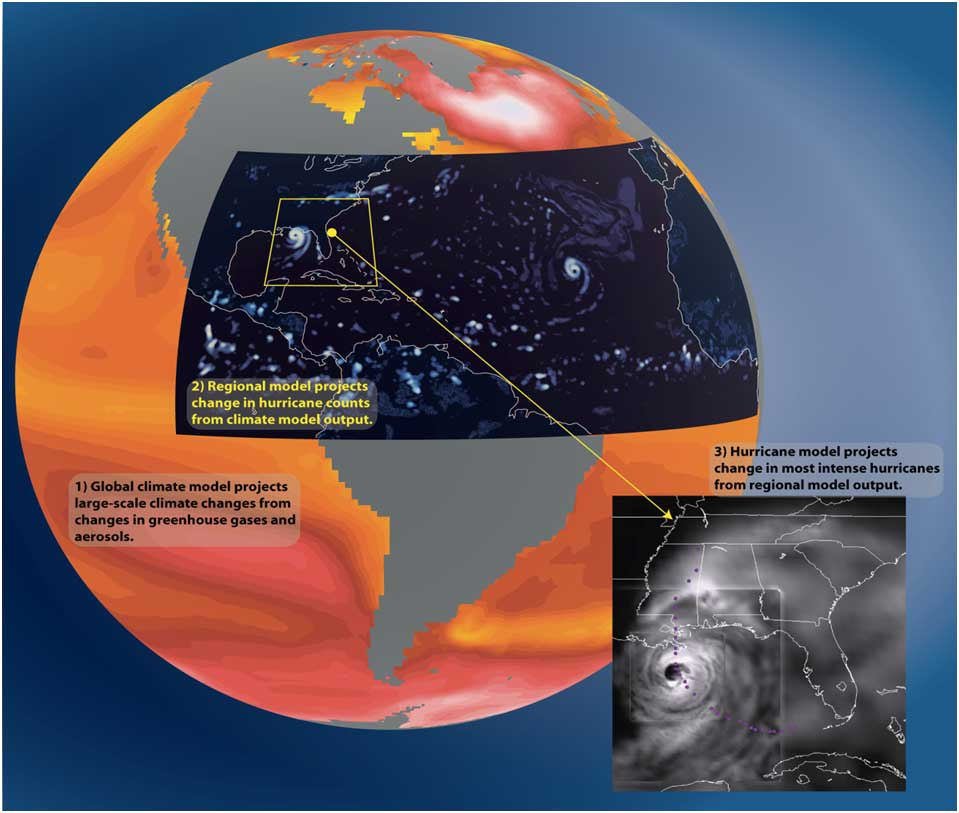
Illustration of dynamical downscaling using nested regional models to refine coarse global outputs to higher-resolution regional projections. This directly supports the notes’ explanation of RCMs and downscaling for local climate impacts. Source.
Uncertainty in Models
Climate models face uncertainty due to:
Incomplete knowledge of feedbacks (e.g., cloud dynamics, ice–albedo).
Uncertainty in future socio-economic choices.
Natural variability in the climate system.
Despite these challenges, consistent patterns such as global warming, polar amplification, and intensified hydrological cycles emerge across models.
Projected Climate Impacts
IPCC models inform projections of:
Sea-level rise: Driven by thermal expansion and ice melt.
Temperature increases: More pronounced in polar regions.
Precipitation changes: Intensified monsoons, droughts, and regional rainfall shifts.
Extreme events: Increased frequency of heatwaves, cyclones, and heavy rainfall events.
These impacts vary regionally, reinforcing the need for both mitigation strategies (reducing emissions) and adaptation strategies (infrastructure and social resilience).
Planning and Policy Applications
Governments and international organisations use IPCC scenarios to:
Establish carbon reduction targets.
Plan coastal defences against rising seas.
Anticipate shifts in agriculture and food security.
Design health strategies for climate-linked diseases.
These models underpin agreements such as the Paris Agreement, where nations pledged to limit warming to “well below 2°C.”
Role in National Planning
Countries integrate IPCC projections into:
Nationally Determined Contributions (NDCs) under the UNFCCC.
National Adaptation Plans (NAPs) for climate resilience.
Example of Application
In Europe, downscaled RCMs project increased heatwaves and drought, leading to adaptation strategies like revised water management and urban cooling infrastructure.
Importance for IB Environmental Systems and Societies
For IB ESS students, understanding IPCC scenarios and climate models is vital because they:
Illustrate the link between science and policy.
Highlight the uncertainty and complexity of climate change.
Demonstrate how systems thinking applies to real-world global challenges.
By grasping these models, students can evaluate how humanity anticipates and responds to the pressing issue of climate change.
Practice Questions
Question 1 (2 marks)
State two variables that climate models use to project future climate impacts.
Mark Scheme:
1 mark for each valid variable, up to 2 marks total.
Possible answers include:Temperature
Precipitation
Sea-level rise
Greenhouse gas concentrations
Radiative forcing
Extreme weather events (frequency/intensity)
Question 2 (5 marks)
Explain how the IPCC uses emissions scenarios and climate models to inform international climate policy.
Mark Scheme:
1 mark: Recognition that IPCC emissions scenarios (e.g. RCPs/SSPs) represent possible future greenhouse gas pathways.
1 mark: Clear link between scenarios and climate models projecting outcomes (temperature, precipitation, sea-level rise).
1 mark: Awareness of uncertainty but usefulness of models for planning.
1 mark: Application to international agreements or national policies (e.g. Paris Agreement, NDCs).
1 mark: Overall explanation of how projections guide mitigation and adaptation decisions.
(Maximum 5 marks, points may be awarded flexibly for depth and clarity.)
FAQ
Scenario-based projections explore a range of possible futures depending on socio-economic choices, emissions, and policy decisions. They are not forecasts of what will definitely happen.
Predictions, by contrast, suggest a single expected outcome. Climate science avoids predictions because human activity, policy, and technological development remain uncertain, making projections the more reliable tool.
Ensembles combine multiple runs of the same model or different models to capture variability and uncertainty.
Benefits include:
Reducing the influence of anomalies in one run.
Highlighting consistent trends across models.
Providing a range of possible outcomes that inform risk assessments.
Scenarios are linked to assumptions about:
Population growth
Energy use and technology adoption
International cooperation or fragmentation
Economic development
These socio-economic narratives shape emissions trajectories, which in turn drive the physical climate outcomes projected in models.
Feedbacks amplify or dampen climate responses in models. Examples include:
Positive feedbacks: ice–albedo effect, methane release from permafrost.
Negative feedbacks: increased plant growth absorbing more CO₂.
Incorporating feedbacks helps refine projections, but also introduces uncertainty.
Regional outputs inform localised strategies, such as:
Designing flood defences in coastal areas.
Planning agriculture around rainfall shifts.
Developing urban heat adaptation policies.
By downscaling global projections, governments can tailor responses to specific vulnerabilities.
