
OCR Specification focus:
‘Apply appropriate mathematical skills to analyse quantitative data drawn from practical investigations.’
Mathematical skills are essential in OCR Biology for processing and analysing experimental data, allowing trends to be identified, relationships to be quantified, and valid conclusions drawn.
The role of mathematical skills in analysis
In experimental biology, mathematical treatment of results provides a structured way to assess evidence and reduce subjective judgement. Students must confidently handle numerical data to support biological reasoning and link outcomes to scientific ideas. These skills are used after raw data have been collected and form the foundation of reliable interpretation.
Key numerical techniques in biological analysis
Basic number handling and data organisation
Students must be comfortable manipulating numbers before carrying out more complex steps. Raw numerical data are typically organised using means, ranges and ratios, allowing biological patterns to emerge.
Mean: The arithmetic average of a dataset, found by summing values and dividing by the number of data points.
A mean is useful because it represents a central value around which individual measurements cluster, helping reduce the influence of variation between repeats.
Range: The difference between the highest and lowest values in a dataset.
A range indicates spread, offering insight into the consistency of repeated results. A small range often suggests strong control of variables.
Percentage change and comparative mathematics
Biological investigations frequently compare conditions, making percentage change a key skill. It contextualises differences by scaling them, enabling fair comparisons between datasets of different magnitude. Ratios and proportions also help describe quantitative relationships, such as surface area-to-volume effects or dilution factors in enzyme or cell culture experiments.
Logarithms, orders of magnitude and large data handling
Some biological data span wide scales, such as populations or microbial counts. Logarithmic scales simplify these values, allowing trends to be interpreted more easily.
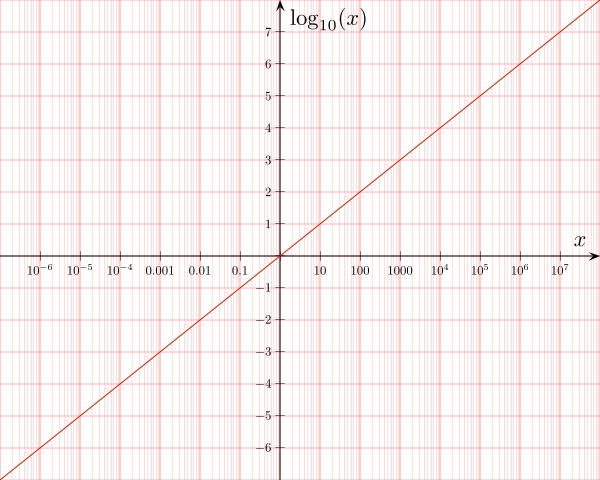
A semi-log graph shows how log scaling compresses large ranges of data, making exponential patterns easier to interpret. It is commonly applied to large biological datasets such as microbial counts. Source.
Orders of magnitude comparisons help clarify the relative size of quantities.
Normal biological sentences go here to separate blocks, maintaining clarity before introducing the next required structure.
EQUATION
—-----------------------------------------------------------------
Percentage Change (%) = ((Final Value − Initial Value) ÷ Initial Value) × 100
Final Value = Measured value at the end of the experiment (unit varies)
Initial Value = Original measured value (unit varies)
—-----------------------------------------------------------------
Rates, time-based calculations and gradients
Rates are central in areas such as photosynthesis, respiration, enzyme activity and population growth. Calculating rate links biological processes to measurable change, allowing meaningful comparison between conditions. Gradients taken from graphs are essential when the rate varies over time, giving a quantitative measure of change.
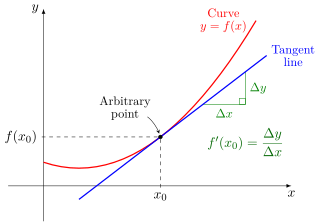
A tangent intersects a curve at a single point, allowing the gradient to be calculated. This represents the instantaneous rate of change, which is essential when biological rates vary over time. Source.
Students must recognise how the gradient reflects change per unit time, and how that applies to biological contexts.
Using mathematical skills to support biological context
Analysis must not stop at number handling. Students must express what the results show biologically. For example, mathematical trends should be linked to mechanisms such as enzyme activity or limiting factors. This ensures that data processing leads to interpretation rather than description.
Presenting data processed mathematically
Use of significant figures and rounding
Biology students must match the number of significant figures to the precision of their data. Over-rounding can hide variation, while excessive figures imply false precision. Rounded values must still reflect the limits of the measuring instrument.
Choosing appropriate units
Units must be written clearly and consistently when calculating or presenting processed values. Conversions (such as cm³ to dm³ or minutes to seconds) must be completed before analysis to avoid distortion of results.
Graphs as mathematical tools
Graphs visually represent patterns, but their usefulness depends on correct scales, axes and plotting. Line graphs are typically used for continuous data and allow gradients to be determined, while bar charts suit discrete categories. Analytical graph use enhances clarity, enabling trends, correlations and anomalies to be identified rapidly.
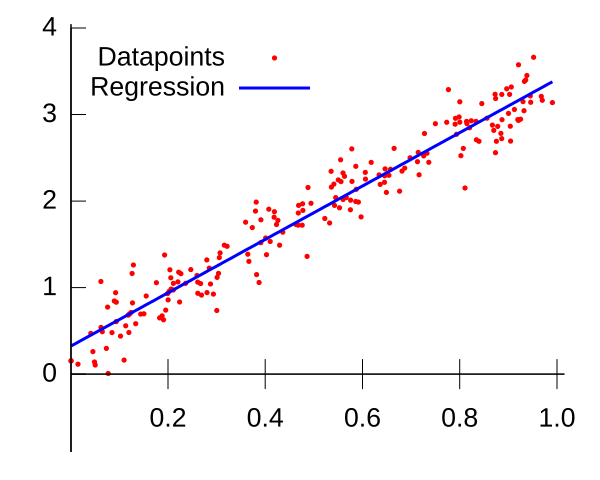
A scatter plot with a line of best fit reveals the direction and strength of a relationship, and makes anomalies easy to identify. This supports clear interpretation of biological trends. Source.
Error consideration during mathematical analysis
Variation, spread and reliability
Processing data mathematically highlights variation, helping judge reliability. Using measures such as ranges allows students to comment on consistency before drawing conclusions. Careful mathematical treatment also supports evaluation, including the identification of anomalies that might skew interpretation.
Percentage error and uncertainty
Although detailed uncertainty treatment sits elsewhere in the specification, mathematical awareness of error strengthens analysis because it prevents overinterpretation of data that contain natural variability. Quantitative judgement of reliability is a core expectation when discussing the validity of conclusions.
Integrating mathematics into written biological interpretation
To meet specification expectations, students must clearly express what their processed data show. Mathematical findings should support arguments, reference biological principles, and lead toward valid, evidence-based conclusions.
Practice Questions
Question 1 (1–3 marks):
A student investigates the effect of salt concentration on the mass of potato tissue. The percentage change in mass is calculated using the initial and final masses of the tissue.
State the formula for percentage change and explain what a negative percentage change indicates about the movement of water.
(3 marks)
Question 1 Mark Scheme (3 marks total):
Formula correctly stated: (Final value − Initial value) ÷ Initial value × 100 (1 mark)
Identifies that a negative percentage change means mass has decreased (1 mark)
Explains this is due to water leaving the potato cells by osmosis (1 mark)
Question 2 (4–6 marks):
A student conducts an enzyme experiment and records the substrate concentration at regular time intervals. The student then plots a line graph and draws a line of best fit.
Describe how the student should process and analyse their data to determine the rate of reaction and comment on the reliability of the results.
(5 marks)
Question 2 Mark Scheme (5 marks total):
Award 1 mark for each valid point, up to 5 marks:
Student should calculate rate using change in substrate concentration divided by time OR by measuring the gradient of the line of best fit (1 mark)
Rate taken from the steepest part of the graph or tangent at the initial linear region for initial rate (1 mark)
Line of best fit used to identify overall trend or pattern in results (1 mark)
Reliability assessed by referring to repeat readings or consistency of data points close to the line (1 mark)
Anomalies identified and commented on (e.g., points that do not fit the trend) (1 mark)
FAQ
The mean is suitable when data are evenly distributed with no extreme values, as it reflects the overall average of the dataset.
The median is more appropriate when the dataset contains anomalies or skewed results, because it reduces the influence of outliers.
In OCR Biology, you would typically present the mean, but knowing when the median is more representative can support your evaluation of data quality.
Percentage change allows fair comparison between datasets that start at different values, making it easier to judge the biological significance of results.
This is especially useful in contexts such as tissue mass, population change or enzyme activity, where initial values vary between samples.
Percentage change also allows clearer visual interpretation in graphs and supports comparative analysis between experiments.
Logarithmic scales are most useful when data span several orders of magnitude, such as bacterial populations, pH-related data or large-scale population changes.
They compress wide-ranging data into a manageable visual form, making trends easier to interpret.
Using a log scale can also turn exponential relationships into straight lines, allowing clearer estimation of rate or correlation.
Look for visual consistency in the plotted data:
• A strong trend shows points close to the line of best fit
• A weak trend shows widespread scatter
• The direction of the line shows whether the relationship is positive or negative
You may also refer to anomalies and how much they influence the pattern.
This level of interpretation is acceptable for A-Level without statistical tests.
A clearly labelled axis with appropriate units and evenly spaced scales is essential so the slope represents a meaningful change over time.
A line of best fit or smooth curve helps reveal the overall pattern, and a tangent can be drawn at a specific point if the rate is not constant.
Graphs with continuous data, minimal scatter, and no misleading scaling provide the most accurate rate calculations.
