
OCR Specification focus:
‘Determine gradients and intercepts from appropriate graphs to obtain key quantitative parameters.’
Measuring gradients and intercepts is essential when analysing experimental data to extract numerical information from linear relationships. Graph skills support valid conclusions by revealing trends, relationships and biological meaning in results.
Understanding the purpose of gradients and intercepts
A gradient shows how one variable changes in relation to another, allowing students to quantify a rate or proportional change. An intercept indicates a value when a variable equals zero, often helping to reveal underlying constants or starting conditions. These numerical features convert visual patterns on graphs into meaningful biological data.
Key graph features in biological investigations
Students must identify:
• Independent variable on the x-axis, selected or controlled by the investigator
• Dependent variable on the y-axis, measured during the investigation
• Line of best fit, which shows the overall trend by balancing scatter above and below the line
• Intercepts where the line crosses an axis
• Gradient, representing the steepness of the line
Defining gradient and intercept in scientific contexts
When trends appear linear, gradients and intercepts allow comparisons between experimental conditions or between biological samples. They help justify conclusions, consistent with OCR expectations for interpreting relationships and determining key values.
Gradient: The numerical value showing the rate of change of the dependent variable with respect to the independent variable.
The gradient indicates how rapidly a biological change occurs, such as a rate of reaction or rate of diffusion, and supports quantitative comparison. It can demonstrate whether a relationship is strong, weak, increasing, decreasing, or constant.
EQUATION
—-----------------------------------------------------------------
Gradient (m) = change in y / change in x
y = Dependent variable (unit varies)
x = Independent variable (unit varies)
—-----------------------------------------------------------------
The intercept provides additional information about the system being measured, such as a baseline value or point of origin.
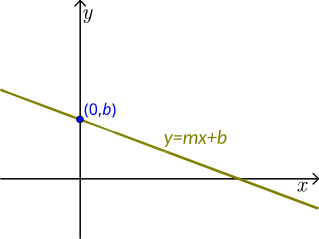
A straight line in slope–intercept form illustrating the y-intercept (b) where the line crosses the y-axis when x = 0. This reinforces how intercepts are read from the axis and then interpreted in context. Source.
Intercept: The point at which a plotted line crosses an axis, usually the y-axis when x = 0.
Between definition blocks, students should remember that gradients and intercepts must always be interpreted in biological terms, not simply calculated, so that the data support contextual understanding.
How to determine a gradient from a graph
When a line of best fit is drawn, the gradient should be determined using two clearly spaced points on the line, not from raw plotted data points. The process is:
• Select two points far apart on the line of best fit
• Read corresponding x and y values to determine coordinate pairs
• Calculate the vertical change (Δy) and horizontal change (Δx)
• Apply the gradient equation to find the rate
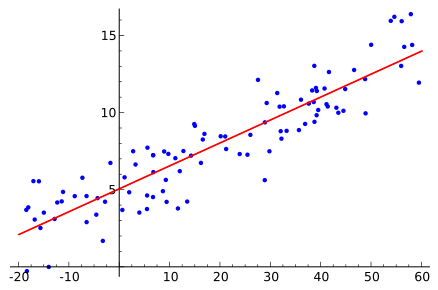
Scatter plot with a best-fit line overlaid. Students can select two far-apart points on the line to compute the gradient and then note the y-intercept from where the line crosses the axis. The figure is uncluttered and labels the regression line distinctly for clarity. Source.
Accuracy and clarity in gradient work
Students must:
• Use units for both variables so gradient units are correct
• Ensure axes have even, sensible scales for reliable measurement
• Avoid choosing points close together, as this increases error impact
Identifying intercepts on graphs
To find the y-intercept, students should extend the line of best fit if necessary and read the value where x = 0. If the intercept carries biological meaning, it must be referenced in the written analysis. Intercepts may indicate:
• A starting concentration
• An initial population size
• A baseline uptake rate
Using gradients and intercepts to support conclusions
OCR requires students to link numerical features back to biological context. Gradients and intercepts should therefore be used to:
• Compare different experimental conditions
• Infer biological significance, such as inhibitory effects or limiting factors
• Support conclusion statements with quantitative evidence
Common pitfalls and how to avoid them
Students should take care to avoid:
• Using plotted points instead of the best-fit line
• Ignoring units when presenting gradient values
• Estimating intercepts without referencing the scale
• Drawing lines that do not reflect the overall trend
Presenting values with appropriate precision
When giving gradient or intercept values, the number of decimal places should match the quality of the data, supporting accuracy and minimising implied certainty.
Graph types and suitability
Gradients and intercepts are only meaningful on graphs showing continuous quantitative data, typically line graphs or scatter graphs with lines of best fit. Axes must be labelled with quantities and units, ensuring clarity for anyone interpreting the values.
Final reinforcement of OCR expectation
To meet OCR requirements, students must be able to determine gradients and intercepts from appropriate graphs and use these numerical values to obtain key quantitative parameters that strengthen data analysis and support valid conclusions in practical biology.
Practice Questions
Question 1 (2 marks)
A student plots a line graph of experimental data and draws a straight line of best fit. Explain how they should determine the gradient of the line.
(2 marks)
Question 1 (2 marks)
Award 1 mark for each valid point:
• Select two well-spaced points on the line of best fit, not the raw data points. (1)
• Calculate the change in y divided by the change in x to obtain the gradient. (1)
Question 2 (5 marks)
A scatter graph is produced to investigate the relationship between light intensity and the rate of photosynthesis. A straight line of best fit is drawn through the points. The student is asked to determine both the gradient and the y-intercept, and then interpret their biological meaning. Describe the steps the student should take to obtain these values and explain how each value could support a valid conclusion about the investigation.
(5 marks)
Question 2 (5 marks)
Award 1 mark for each valid point, up to 5 marks:
• Read two widely spaced coordinates from the line of best fit to calculate the gradient. (1)
• Use change in y divided by change in x to determine the gradient value. (1)
• Extend or inspect the line where x = 0 to determine the y-intercept. (1)
• Correct interpretation of the gradient as the rate of change of the dependent variable with the independent variable, e.g., the rate of photosynthesis increases per unit of light intensity. (1)
• Correct interpretation of the intercept as an initial or baseline value before the variable changes, e.g., rate of photosynthesis when light intensity is zero. (1)
FAQ
Check the overall pattern of points on the scatter graph. If they form a roughly straight-line trend, increasing or decreasing at a steady rate, the relationship is likely to be linear.
If the pattern curves, levels off, or changes direction, the relationship is not linear and a gradient from a straight line would be misleading.
Using widely spaced points reduces the effect of small plotting or reading errors on the calculated value.
When points are close together, even a tiny inaccuracy in reading the axes can produce a disproportionately large change in the gradient, reducing reliability.
A y-intercept may be meaningless when the value at x = 0 does not represent a realistic biological condition.
For example, some systems cannot exist at zero concentration, zero time, or zero light, so the intercept becomes a mathematical rather than biological feature.
Ensure:
• both axes are scaled evenly
• units are shown clearly
• the plotted values cover an appropriate range
Uneven scaling or missing units can distort interpretation and lead to incorrect gradient and intercept measurements.
A steep gradient indicates a rapid change in the dependent variable for a small change in the independent variable, suggesting a strong or fast biological response.
A shallow gradient shows a slower or weaker response, with the dependent variable changing only slightly as the independent variable increases.
