
OCR Specification focus:
‘Use a justified number of significant figures consistently when presenting calculated values and final answers.’
Significant figures ensure numerical data from biological experiments is reported with appropriate precision. Correct use prevents false accuracy, supports fair comparison, and strengthens confidence in calculated biological outcomes.
Using Significant Figures Correctly
Presenting numerical data clearly is a core analytical requirement in biology. Experimental measurements, processed data and final values must be expressed to a justified number of significant figures, reflecting the precision of the original data and any measuring instruments. Using too many figures implies unrealistic certainty, while too few can hide meaningful differences. The OCR specification requires students to use a justified number of significant figures consistently when presenting calculated values and final answers.
What Are Significant Figures?
The term significant figures refers to the digits in a value that meaningfully represent its measured precision, starting from the first non-zero digit. Calculated biological results depend on earlier data, so the number of significant figures used should track the reliability of recorded measurements.
Significant Figures: The meaningful digits in a number that reflect the precision of the measurement or calculation, beginning with the first non-zero digit.
In biological investigations, significant figures are closely linked to apparatus resolution, measurement uncertainty, and the clarity of processed data such as rates, means, or percentages.
Rules for Identifying Significant Figures
Students should apply consistent rules when counting significant figures.
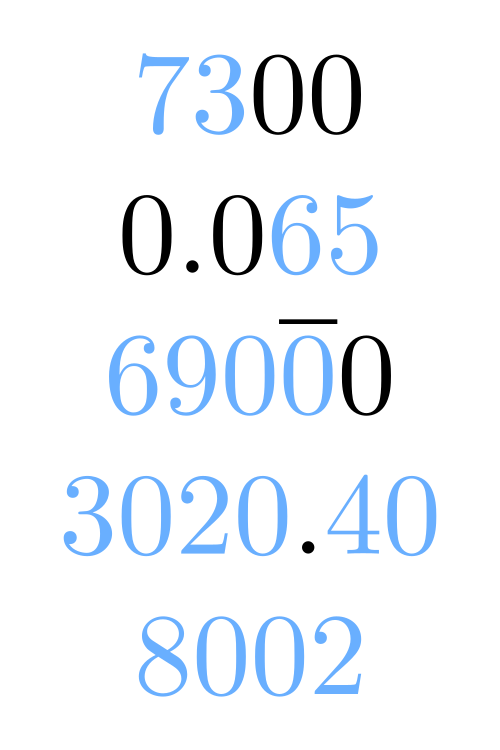
This diagram illustrates which digits count as significant figures in different numerical formats, reinforcing the rules that determine how students should identify meaningful digits in biological data. Source.
Key rules include:
All non-zero digits are significant
Zeros between non-zero digits are significant
Leading zeros are not significant
Zeros after a decimal point are significant if they follow a non-zero digit
Zeros at the end of a whole number may or may not be significant, depending on context and stated precision
These rules ensure that numerical values are handled systematically, avoiding misinterpretation during data processing.
Linking Significant Figures to Biological Data
Biological measurements often involve volumes, masses, times, absorbance readings or cell counts. Each value has a measurement resolution based on the equipment used, such as a balance reading to 0.01 g or a stopwatch to 0.1 s.
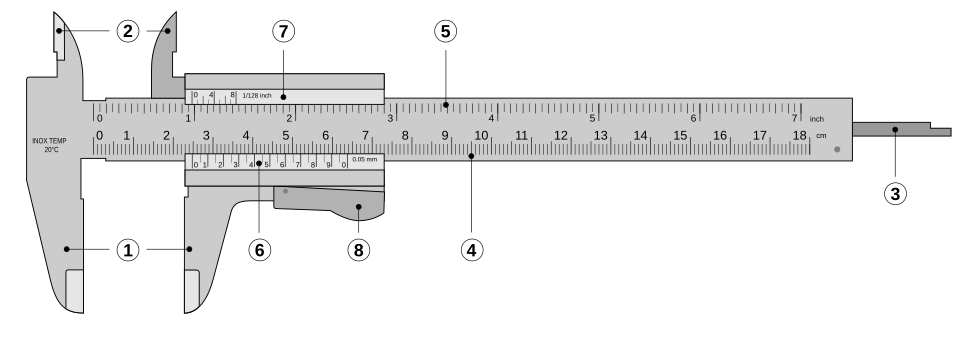
A vernier caliper illustrates how instrument resolution determines the precision of recorded measurements, which in turn limits how many significant figures should be used in calculated biological values. Source.
A result cannot be more precise than its least precise measurement. Therefore, the number of significant figures in a calculated answer must reflect the data used to generate it.
Consistency and Justification
The OCR specification emphasises consistent and justified use of significant figures. Justification means selecting the number of significant figures based on measurement precision, not personal preference. Consistency means applying this choice across calculations, graphs, and final statements.
Students should check that:
Raw data are recorded to the resolution of the instrument
Processed values (e.g. means or rates) are rounded to a sensible number of significant figures based on the original data
Final answers do not introduce extra precision
Rounding and Final Answers
Rounding decisions should be made at the end of calculations, not during intermediate steps, to prevent rounding errors. Final numerical answers must be rounded logically to match the significant figures of the limiting measurement.
Rounding: The process of reducing the number of digits in a value while keeping it close to the original, based on mathematical rules for the final digit.
Significant Figures in Graphs and Data Presentation
Graphical axes, units and processed tables must use matching significant figures so data can be compared reliably. Biological trends are clearer when numerical precision is standardised. Students should ensure:
Axis values use a consistent number of significant figures
Means from repeated measurements are rounded appropriately
Gradients and intercepts from graphs do not contain unjustified precision
Significant Figures, Uncertainty and Apparatus Precision
Significant figures relate directly to experimental uncertainty, because uncertainty limits how precisely a value can be trusted. A measurement with high uncertainty should not be represented with many significant figures, as this contradicts the actual reliability of the data.
Uncertainty: The range within which the true value is expected to lie, based on the precision and limitations of the measuring instrument.
Because biological systems and equipment introduce variability, realistic use of significant figures signals accurate scientific reporting. This aligns with OCR expectations for valid conclusions based on appropriately processed data.
Good Practice Checklist
Students can improve accuracy and clarity by following these principles:
Match significant figures to the least precise measurement
Avoid mixing significant figures within a single data set
Round only at the end of calculations
Check that values in tables, graphs and final answers are consistent and justified
Never imply false precision by including unnecessary digits
Correct mastery of significant figures ensures that biological results are communicated with honesty, precision and scientific credibility, meeting OCR practical analysis requirements.
Practice Questions
Question 1 (2 marks)
A student calculates the mean rate of an enzyme reaction as 0.8421 cm3 s-1. The raw data used in the calculation was recorded to two significant figures.
State the value the student should record for the mean, giving a suitable number of significant figures, and explain your reasoning.
Question 1 (2 marks)
Award 1 mark for:
• Rounded value to two significant figures (for example 0.84 cm3 s-1)
Award 1 mark for:
• Explanation that the number of significant figures in the mean should match the least precise measurement in the raw data (or similar wording)
Question 2 (5 marks)
A biology student records the change in mass of potato cylinders in a water potential experiment. The balance used has a resolution of 0.01 g. The student calculates percentage change in mass and presents the final values to five significant figures.
Explain why the student’s presentation of data is not appropriate, and describe how the student should decide on and apply a justified number of significant figures in the final results.
Question 2 (5 marks)
Award up to 5 marks for the following valid points (any 5):
• The final value should not be presented to more significant figures than the raw data or the instrument allows
• Five significant figures imply greater precision than the balance resolution of 0.01 g
• Significant figures must reflect the precision and uncertainty of the measuring instrument
• The limiting measurement determines the maximum appropriate number of significant figures
• The student should round final processed values (such as percentages) to a consistent number of significant figures
• A justified number of significant figures should be applied across all processed data to avoid implying false precision
• The number of significant figures chosen must be consistent within the data set (graphs, tables and final values)
FAQ
Significant figures reflect the precision of a measurement, whereas decimal places only count digits after the decimal point. A number with fewer decimal places can still have more significant figures, depending on the digits it contains.
In biological data, significant figures are preferred because they preserve information about measurement certainty, which is essential for fair comparison and valid interpretation of results.
Any calculated value is limited by the weakest piece of data used to produce it. Using more significant figures than the least precise measurement implies certainty that does not exist.
This prevents false precision and ensures calculated biological values, such as rates or means, remain realistic and scientifically defensible.
If the digit to be removed is exactly 5, with no following digits, a common convention is to round to the nearest even digit. This prevents bias in repeated rounding.
For example:
• 2.85 rounded to two significant figures becomes 2.8
• 2.95 rounded to two significant figures becomes 3.0
Repeating decimals (for example from division) can imply a level of exactness that is not supported by biological measurements. Rounding limits the value to a sensible number of significant figures.
This keeps processed results usable in graphs, tables and comparisons, ensuring clarity in experimental interpretation.
Using consistent significant figures standardises precision, allowing fair comparison between data sets.
If one source reports unnecessary digits, while another rounds sensibly, it becomes harder to judge reliability. By applying justified significant figures, researchers avoid misleading contrasts and maintain scientific transparency.
