
OCR Specification focus:
‘Describe principles and uses of electrophoresis to separate DNA, RNA or proteins by size or charge for analysis.’
Electrophoresis is a vital analytical technique used in molecular biology to separate nucleic acids and proteins based on their size and charge, enabling identification and analysis.
Principles of Electrophoresis
Electrophoresis works by moving charged molecules through a gel matrix under the influence of an electric field. The technique separates molecules according to their molecular weight and net charge, allowing scientists to identify genetic material or proteins with precision.
The Electric Field and Charge
When an electric current is applied across a gel:
Negatively charged molecules (like DNA and RNA) migrate towards the positive electrode (anode).
Positively charged molecules, such as some proteins, move towards the negative electrode (cathode).
The rate of migration depends on:
The molecule’s charge density (amount of charge per unit mass).
The molecular size (smaller molecules move faster).
The gel concentration, which controls the matrix’s pore size.
The applied voltage, influencing migration speed.
Components of an Electrophoresis System
The Gel Matrix
The gel acts as a molecular sieve through which molecules travel.
Agarose gel is commonly used for DNA and RNA because it forms large pores suitable for nucleic acid fragments.
Polyacrylamide gel is used for proteins and small nucleic acids due to its tighter pore structure, offering higher resolution.
Agarose gel electrophoresis: A technique using agarose polymer gel to separate DNA or RNA fragments by size through an electric field.
The Buffer Solution
The buffer maintains a stable pH and provides ions to conduct the electric current. Common buffers include TAE (Tris-acetate-EDTA) and TBE (Tris-borate-EDTA). These prevent damage to samples and ensure consistent migration.
The Power Supply and Gel Apparatus
The power pack delivers a controlled voltage.
The gel tank holds the buffer and electrodes.
Samples are loaded into wells at one end of the gel.
The current drives molecules through the gel towards the opposite electrode.
A typical electrophoresis setup comprises a gel cassette or tray in buffer between electrodes connected to a power supply, with a comb-formed well array for loading samples.
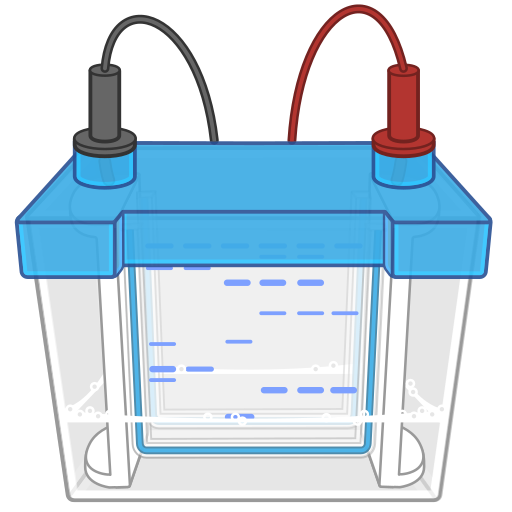
Vector illustration of protein gel electrophoresis equipment, including the gel cassette submerged in buffer with cathode and anode connections. This clarifies how an electric field is applied across the gel to drive protein separation (e.g. SDS-PAGE). The drawing includes general labware detail not essential for OCR assessment but aids equipment recognition. Source.
Electrophoresis of Nucleic Acids
DNA and RNA Separation
DNA and RNA molecules have a uniform negative charge because of their phosphate backbone. This means that electrophoretic separation depends mainly on fragment length, not differences in charge.
Electrophoresis separates nucleic acids in a gel matrix because fragments experience uniform charge-to-mass forces and are sieved by pore size, so migration distance inversely reflects fragment length.
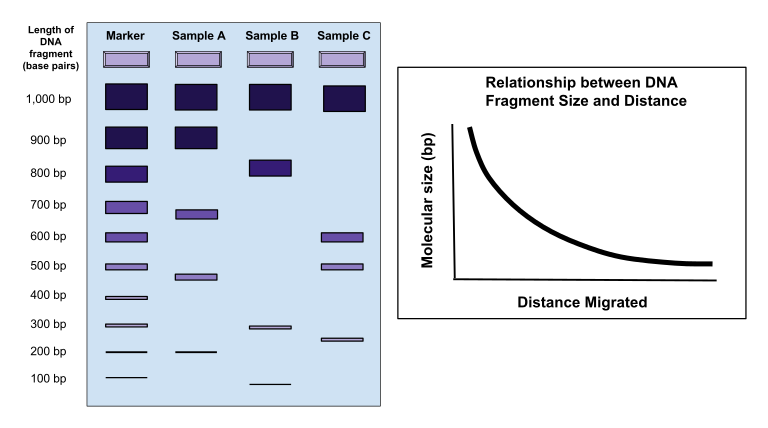
A labelled schematic of a DNA gel showing wells, lanes, and bands, alongside a graph of migration distance vs fragment size. It visually connects band position with fragment length, aligning with how gels are interpreted. The small graph extends beyond the minimum OCR requirement but clarifies the inverse relationship used to estimate sizes. Source.
Steps in agarose gel electrophoresis:
Prepare the agarose gel in buffer and pour into a tray with a comb to create wells.
Load DNA samples, often mixed with loading dye to visualise movement.
Apply an electric current across the gel.
Fragments migrate; shorter DNA fragments move faster and travel further.
Stain the gel using ethidium bromide or SYBR Safe to visualise bands under UV light.
Smaller DNA fragments migrate further through the agarose towards the anode than larger fragments, producing distinct bands alongside a DNA ladder for size estimation.
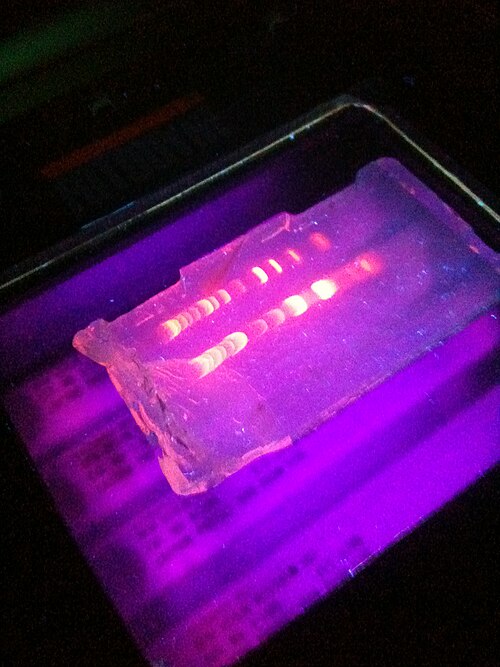
Agarose gel showing DNA bands separated by size, with a molecular size marker (DNA ladder) in an adjacent lane. Smaller fragments have travelled further through the gel matrix under the electric field. This visual supports interpretation of band position relative to the ladder for approximate fragment sizing. Source.
DNA ladder: A mixture of DNA fragments of known sizes used as a reference to determine the length of unknown DNA fragments during electrophoresis.
Applications of Nucleic Acid Electrophoresis
Electrophoresis allows:
Verification of PCR products for correct fragment size.
DNA fingerprinting and forensic profiling when used with restriction enzymes.
Checking RNA integrity before gene expression analysis.
Sequencing preparation and plasmid analysis.
Electrophoresis of Proteins
The Nature of Protein Charge
Proteins differ from nucleic acids because their charge depends on their amino acid composition and pH. At a given isoelectric point (pI), a protein has no net charge and will not move in an electric field.
Isoelectric point (pI): The pH at which a protein carries no net electrical charge and therefore does not migrate in an electric field.
SDS–PAGE: Denaturing Protein Electrophoresis
To ensure separation by size only, proteins are treated with sodium dodecyl sulfate (SDS) and a reducing agent such as β-mercaptoethanol.
SDS binds uniformly along the polypeptide, giving each molecule a negative charge proportional to its length and denaturing the protein to a linear shape.
Steps:
Proteins are mixed with SDS and buffer.
The mixture is loaded into polyacrylamide gel wells.
The electric field causes migration according to molecular weight.
Smaller proteins travel faster through the gel pores.
After electrophoresis, proteins are stained with Coomassie Blue or silver stain to visualise bands.
Native PAGE
In native PAGE, proteins remain in their natural folded state. Migration depends on both size and charge, useful for studying protein-protein interactions or enzyme activity.
Visualisation and Analysis of Electrophoresis Results
Staining Techniques
After separation, molecules must be visualised:
DNA/RNA gels: Stained with ethidium bromide or safer alternatives (e.g. GelRed, SYBR Green) that bind to nucleic acids and fluoresce under UV light.
Protein gels: Stained with Coomassie Brilliant Blue for general detection or silver stain for high sensitivity.
Interpretation of Results
The distance migrated is inversely proportional to log(molecular size).
Comparing samples with a standard molecular weight marker allows estimation of fragment or protein sizes.
Band intensity indicates the relative abundance of molecules.
Applications of Electrophoresis in Biology
Electrophoresis is essential across biological and biomedical sciences, providing insight into molecular identity and purity.
Key uses include:
Forensic analysis: Identifying individuals using DNA profiling.
Genetic research: Studying mutations and verifying gene cloning.
Clinical diagnostics: Detecting abnormal proteins such as haemoglobin variants or enzymes.
Proteomics: Analysing protein composition and expression using 2D electrophoresis (separation by charge and size).
Molecular biology workflows: Confirming results from PCR, restriction enzyme digestion, and recombinant DNA experiments.
Two-dimensional electrophoresis (2D-PAGE): A method combining isoelectric focusing (separation by charge) and SDS-PAGE (separation by size) to analyse complex protein mixtures.
Electrophoresis thus remains a cornerstone of genetic and biochemical analysis, allowing researchers to visualise, compare, and identify nucleic acids and proteins with precision and reliability, in accordance with the OCR Biology specification.
Practice Questions
Question 1 (2 marks)
Explain how agarose gel electrophoresis separates fragments of DNA.
Mark scheme:
DNA fragments have a uniform negative charge due to their phosphate backbone (1 mark)
When an electric current is applied, the fragments migrate through the gel matrix towards the positive electrode (1 mark)
Smaller fragments move faster and travel further through the gel (accept equivalent phrasing) (1 mark; maximum 2 marks total)
Question 2 (5 marks)
Compare the use of agarose gel electrophoresis and SDS-PAGE in the analysis of biological molecules.
Mark scheme:
Agarose gel electrophoresis is used for nucleic acids (DNA/RNA), while SDS-PAGE is used for proteins (1 mark)
Agarose gels are made from agarose polymer and have large pores suitable for separating DNA fragments by length (1 mark)
SDS-PAGE uses polyacrylamide gel with smaller pores for high-resolution separation of proteins (1 mark)
SDS treatment gives proteins a uniform negative charge and denatures them, so separation depends only on molecular size (1 mark)
In agarose gels, separation depends on fragment size, as DNA molecules have uniform charge from their phosphate backbone (1 mark)
Credit comparative statements (e.g., “Agarose separates by size alone due to uniform charge; SDS-PAGE separates by size after charge equalisation”) (1 mark; maximum 5 marks total)
FAQ
Resolution depends on several physical and chemical factors that influence how distinctly molecules separate within the gel.
Gel concentration: Higher agarose or acrylamide concentrations create smaller pores, improving separation of small fragments but hindering large ones.
Voltage and run time: Too high a voltage causes overheating and band smearing; too low results in diffuse bands.
Buffer composition and pH: A stable pH ensures consistent charge on molecules and prevents distortion.
Sample loading: Overloading wells or uneven loading leads to distorted or merged bands.
Careful control of these variables ensures sharp, distinct bands suitable for analysis.
Ethidium bromide is highly effective at intercalating into DNA, allowing fluorescence under ultraviolet light, but it is mutagenic and requires special disposal procedures.
Safer fluorescent stains such as SYBR Safe, GelRed, and GelGreen provide similar visibility with lower toxicity and can often be visualised using blue light instead of UV, reducing DNA damage and improving safety for laboratory use.
These alternatives maintain comparable sensitivity while greatly reducing environmental and health risks.
Although electrophoresis is often used for qualitative assessment, quantitative analysis is possible using densitometry or imaging software.
Digital gel documentation systems capture high-resolution images of stained gels.
Software then measures band intensity, which correlates with DNA or protein concentration.
A standard curve generated from known concentrations allows estimation of sample quantities.
This method provides accurate, reproducible quantification suitable for molecular diagnostics and research.
PFGE is a specialised form of electrophoresis designed for separating very large DNA fragments (up to several million base pairs) that cannot migrate efficiently in standard gels.
It works by periodically changing the direction of the electric field, forcing large DNA molecules to reorient as they move through the gel. This allows clear resolution of large genomic fragments that would otherwise appear as a single band.
PFGE is commonly used in bacterial strain typing, epidemiological investigations, and genome mapping.
Isoelectric focusing separates proteins based on their isoelectric point (pI) rather than size.
A pH gradient is established within a gel.
Each protein migrates until it reaches the region where the pH equals its pI, at which point it becomes neutral and stops moving.
Unlike SDS-PAGE, proteins remain in their native or partially folded state.
Isoelectric focusing provides highly precise charge-based separation and is often the first step in two-dimensional electrophoresis (2D-PAGE), preceding SDS-PAGE for size-based resolution.
